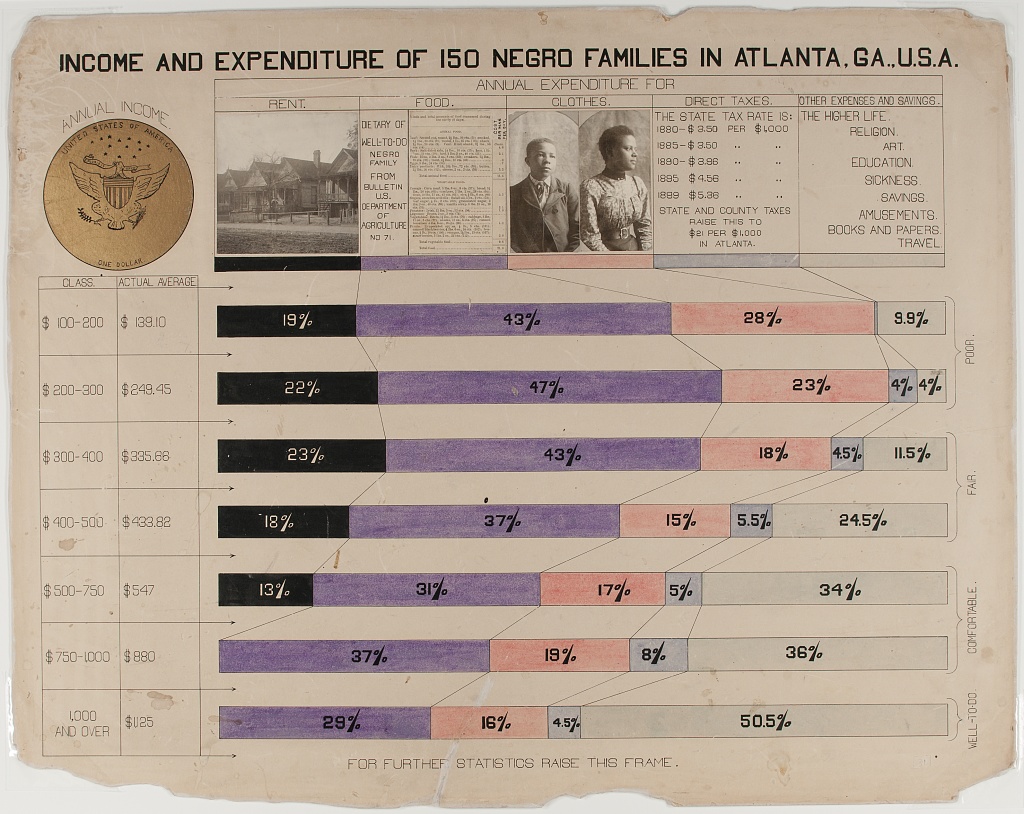
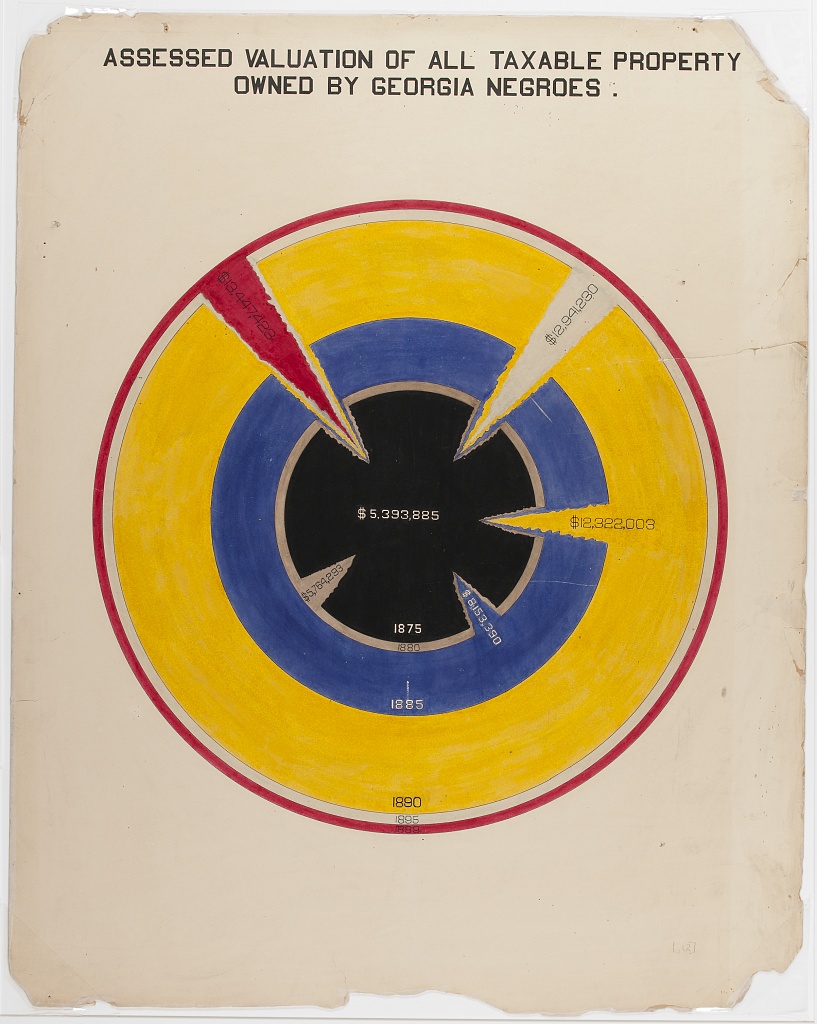
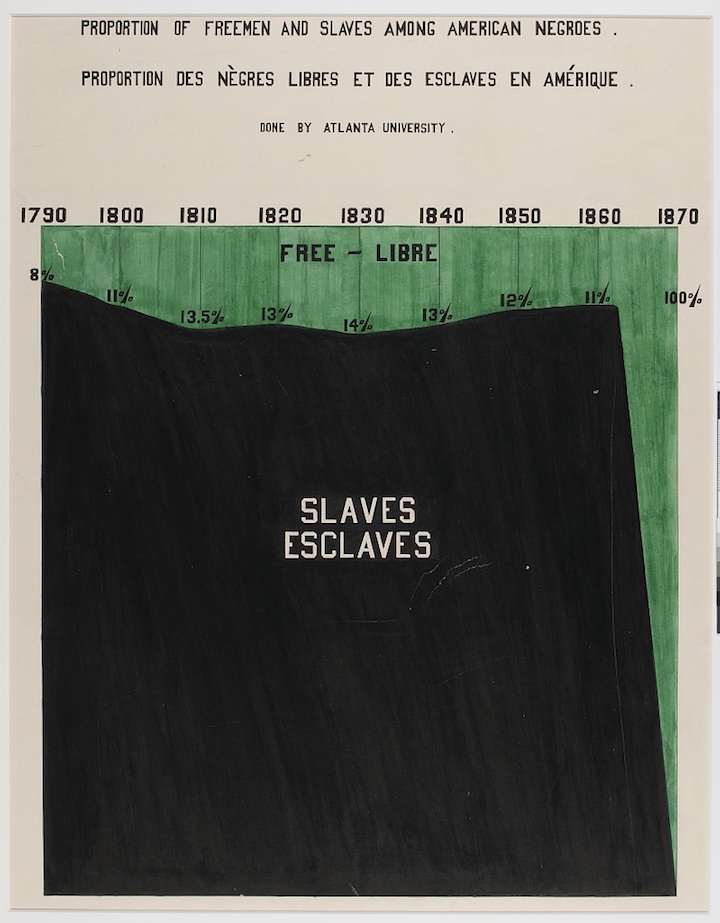
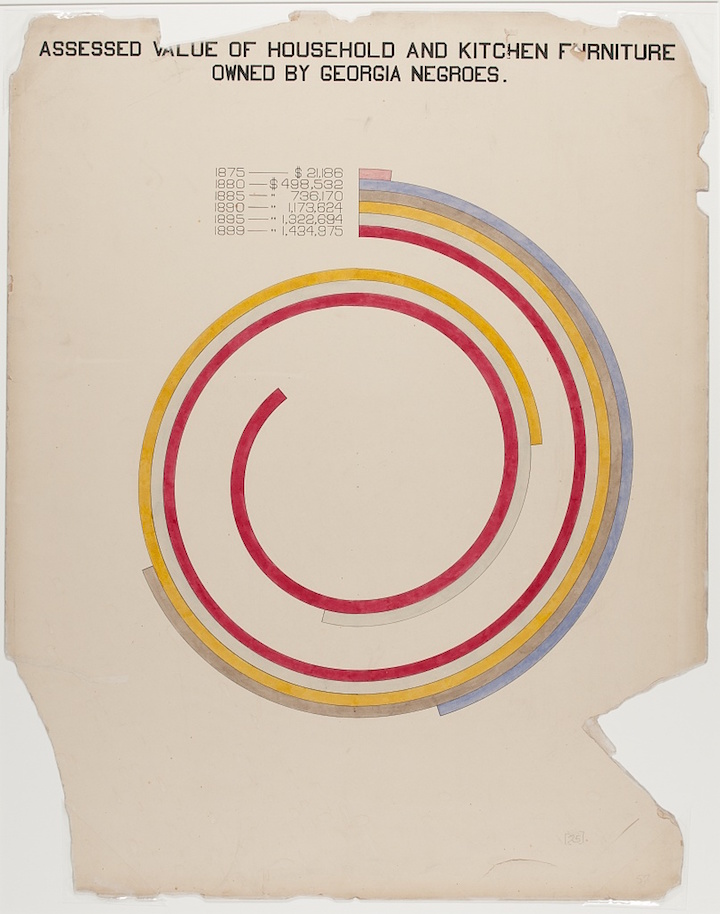
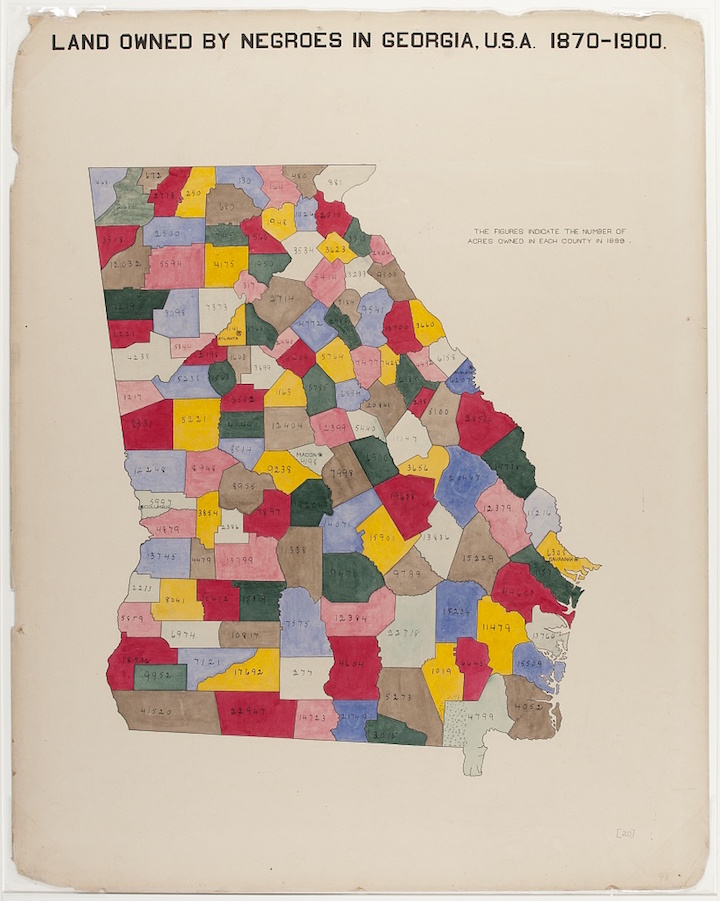
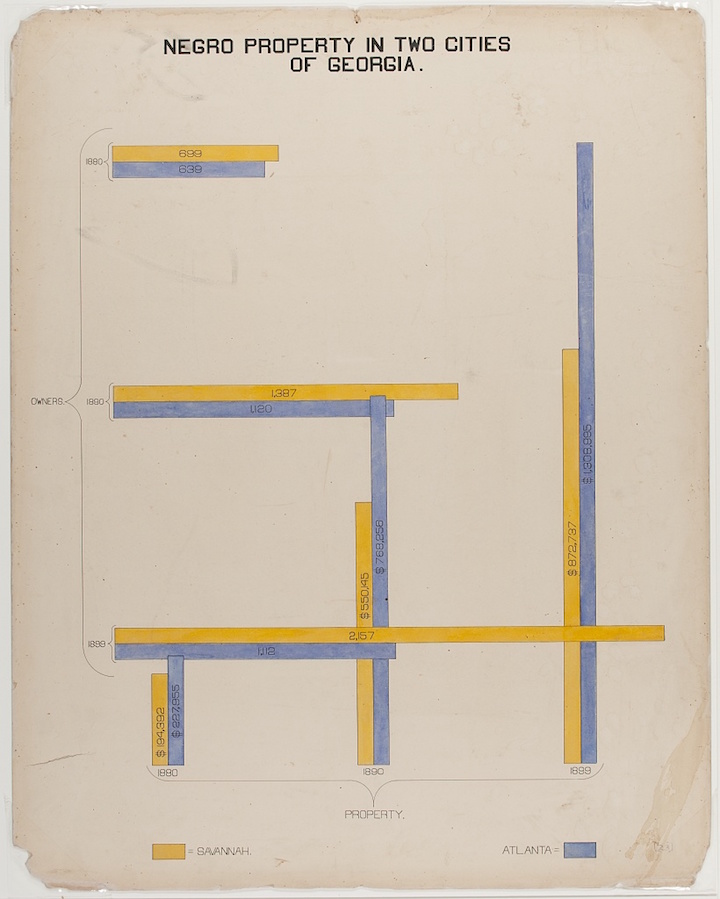
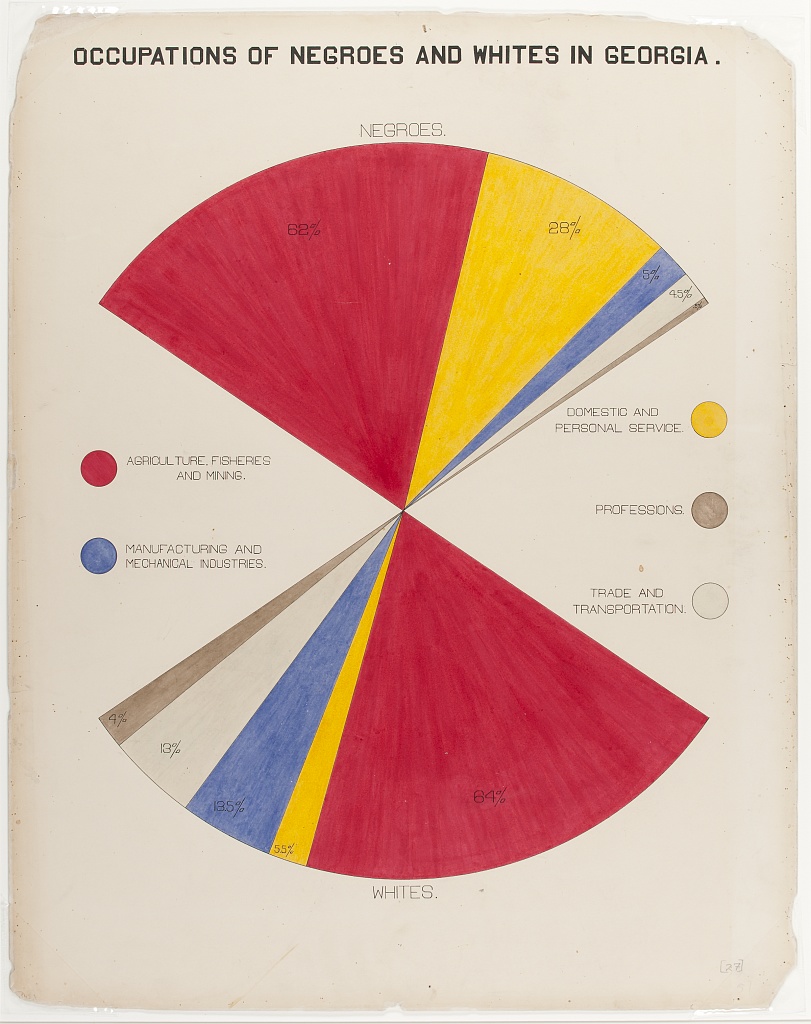
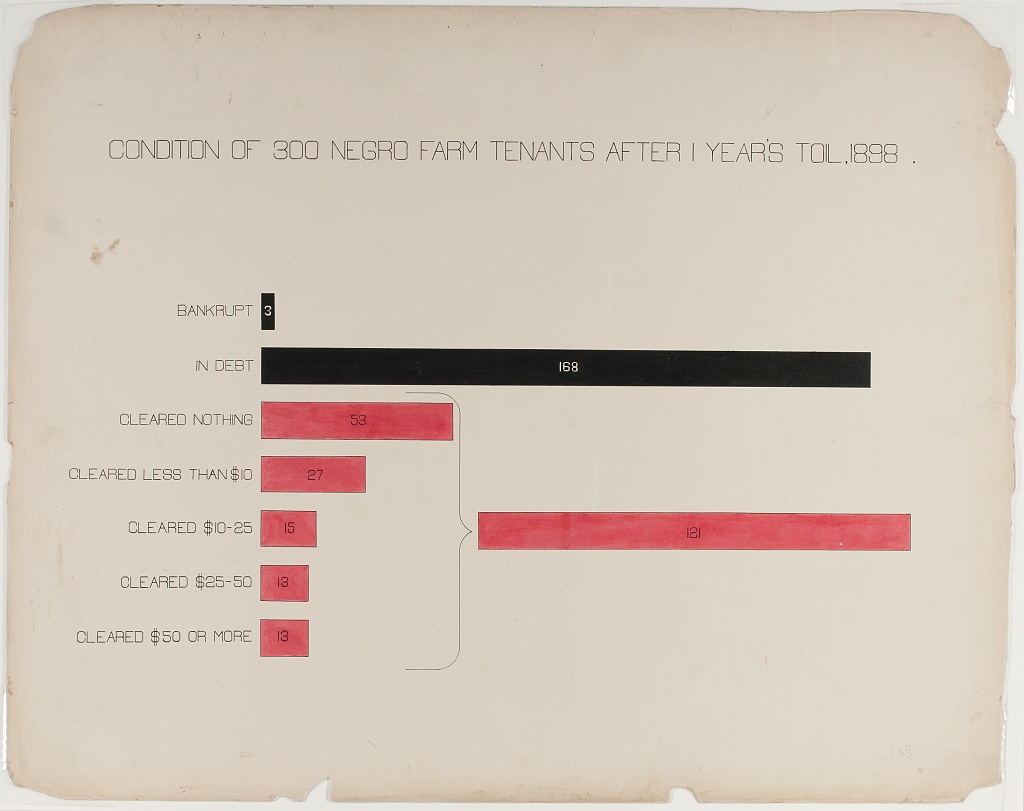
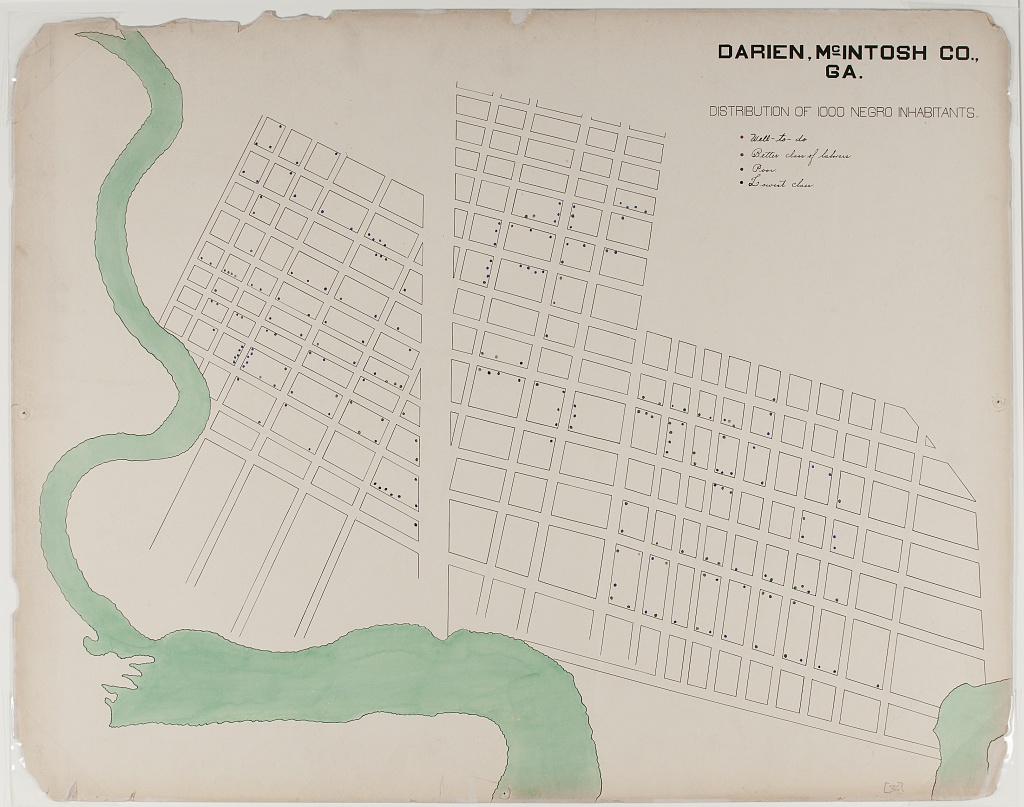
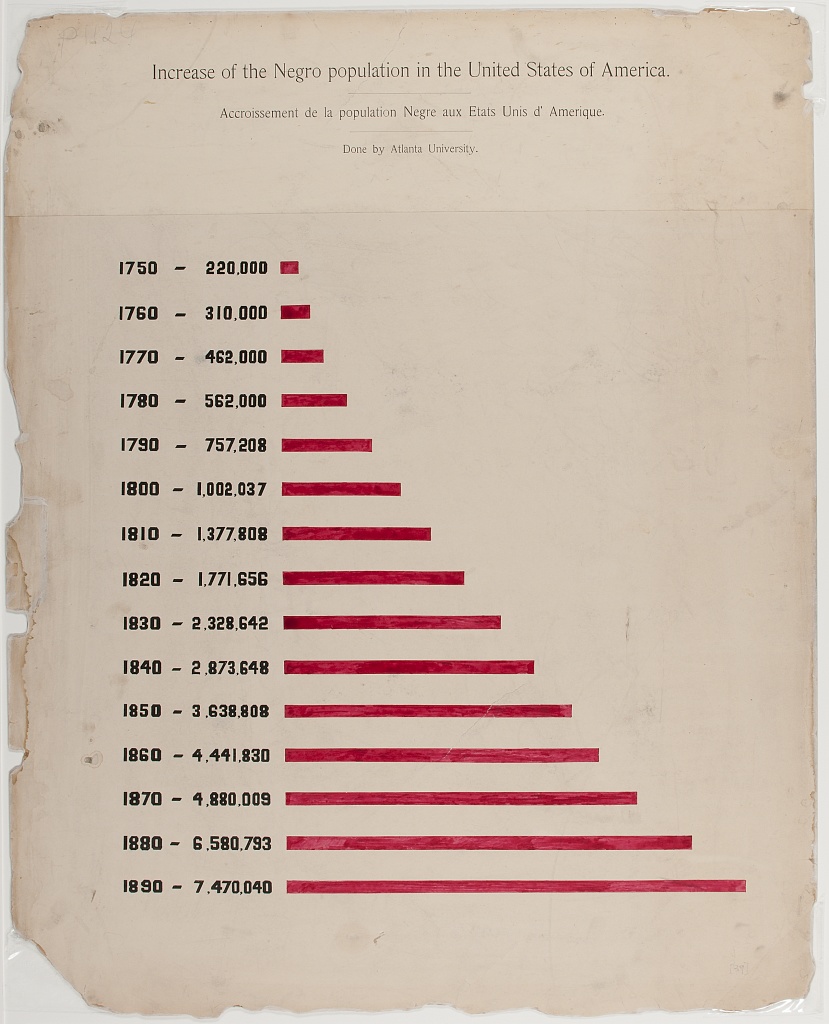
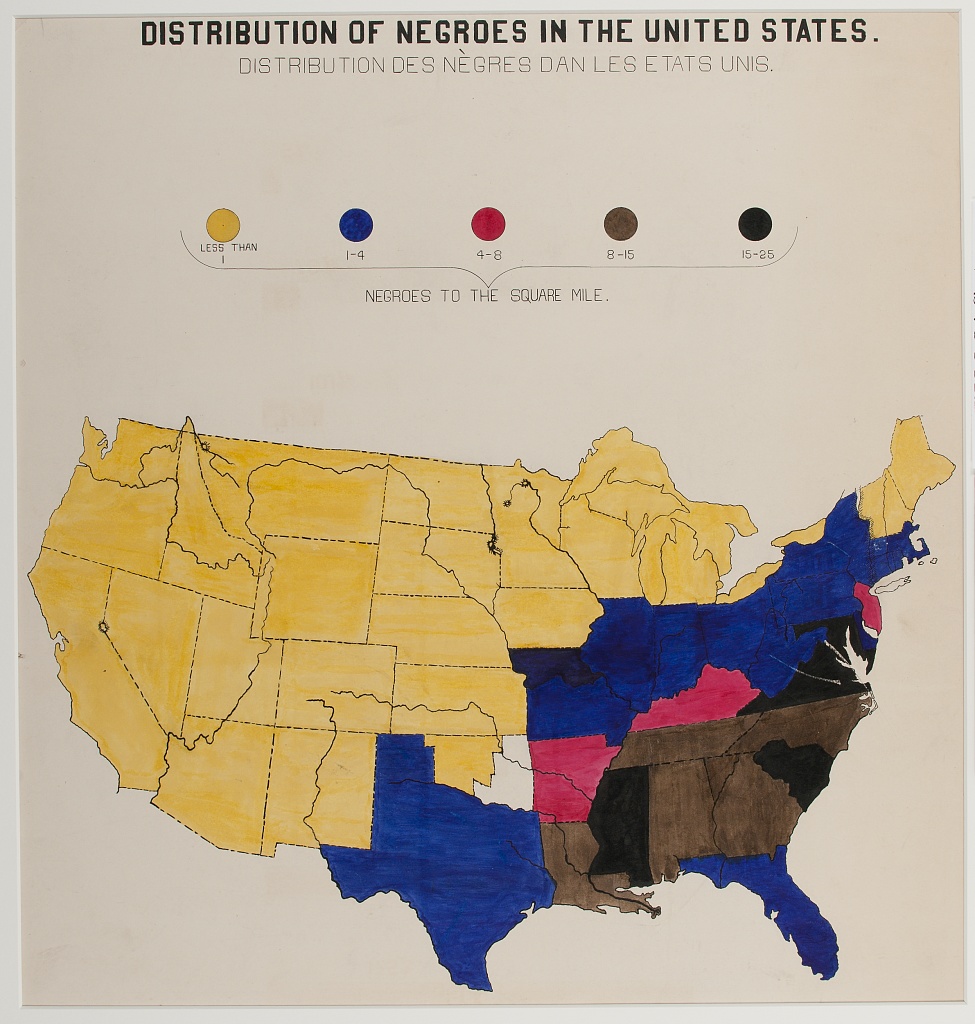
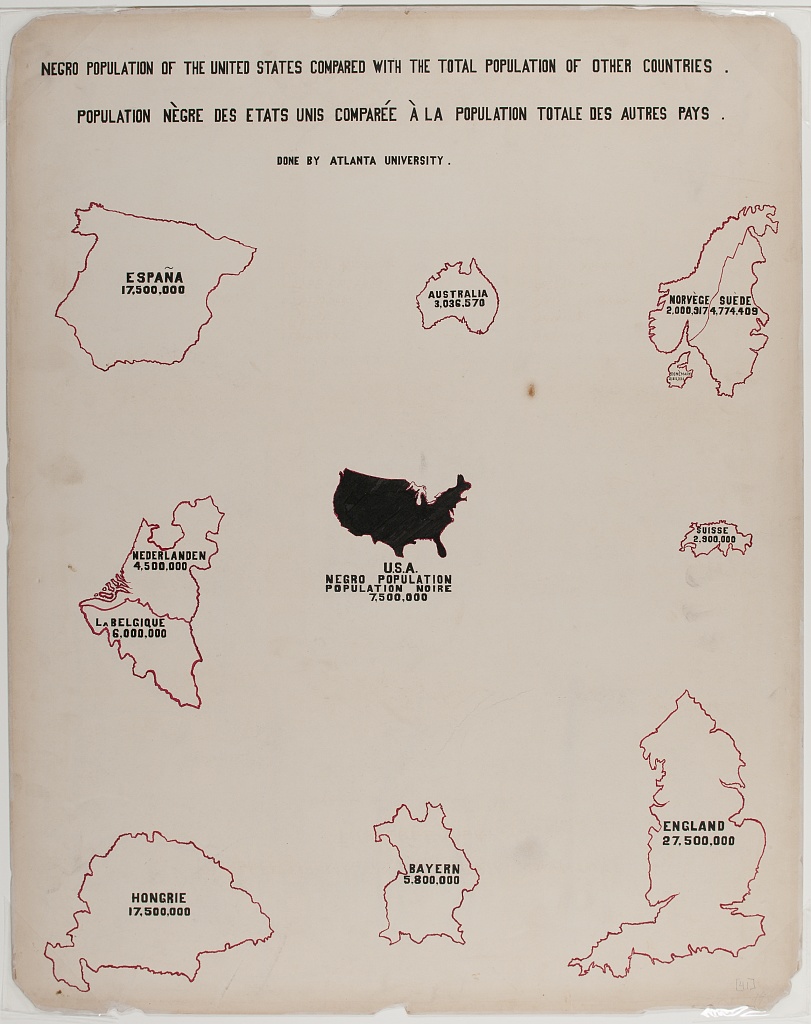
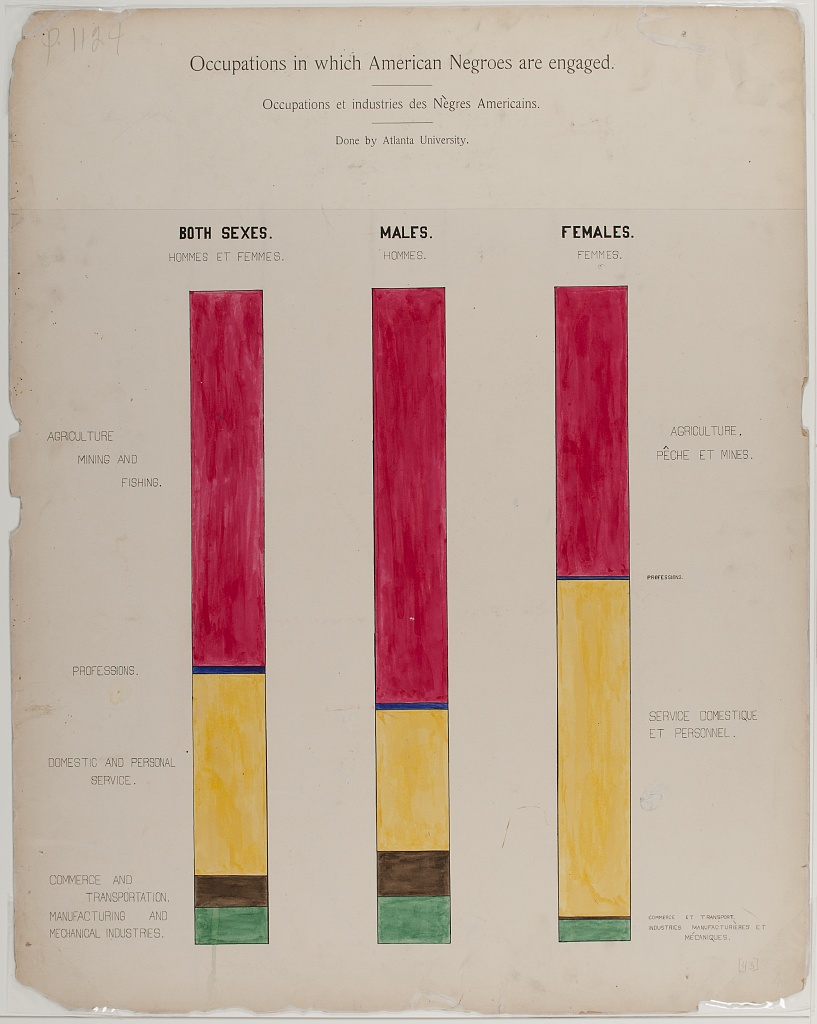
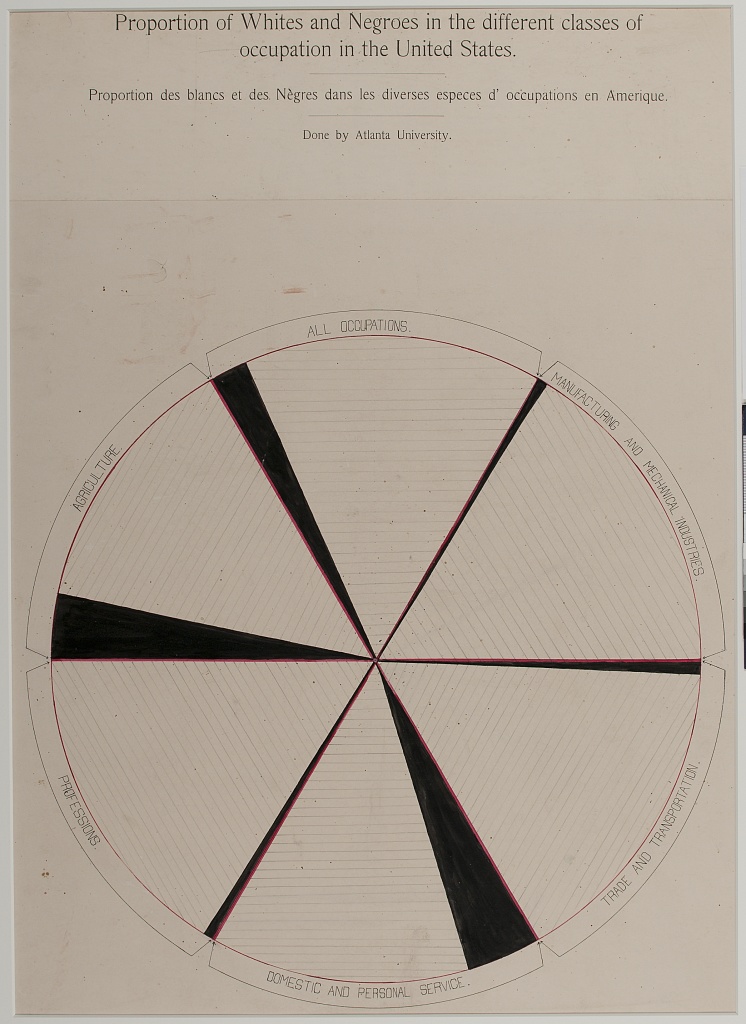
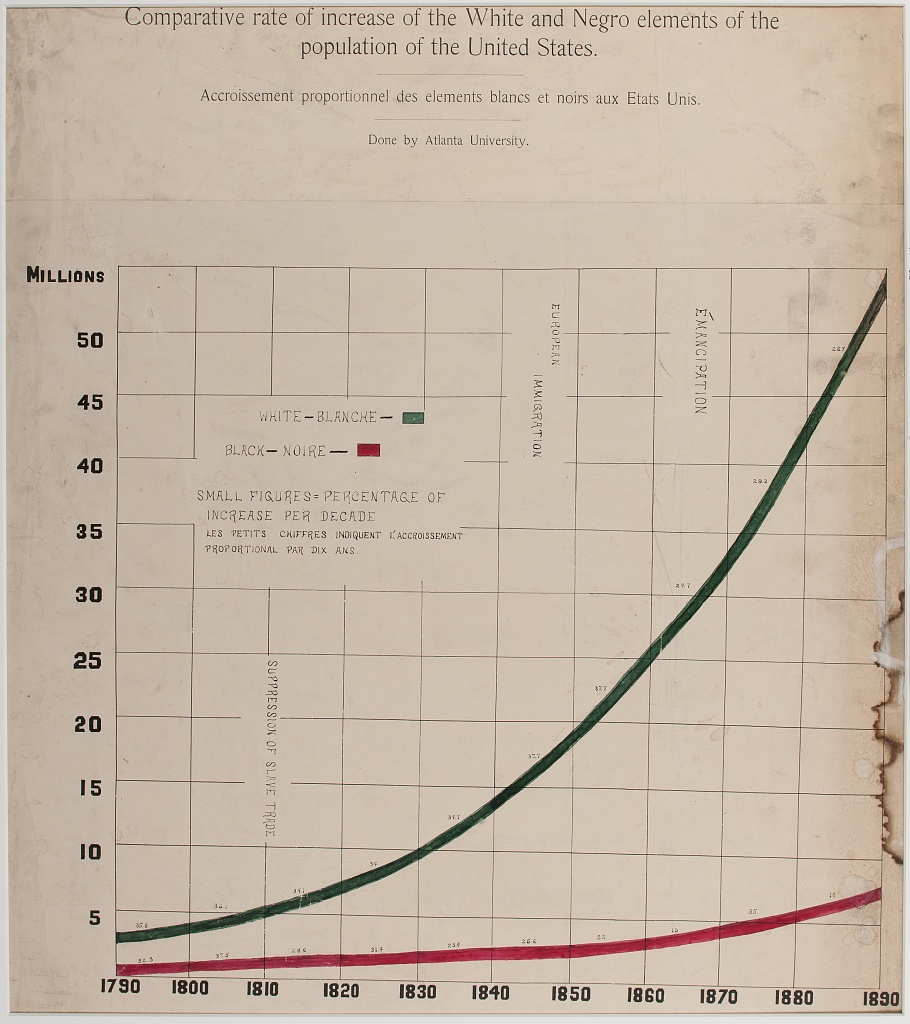
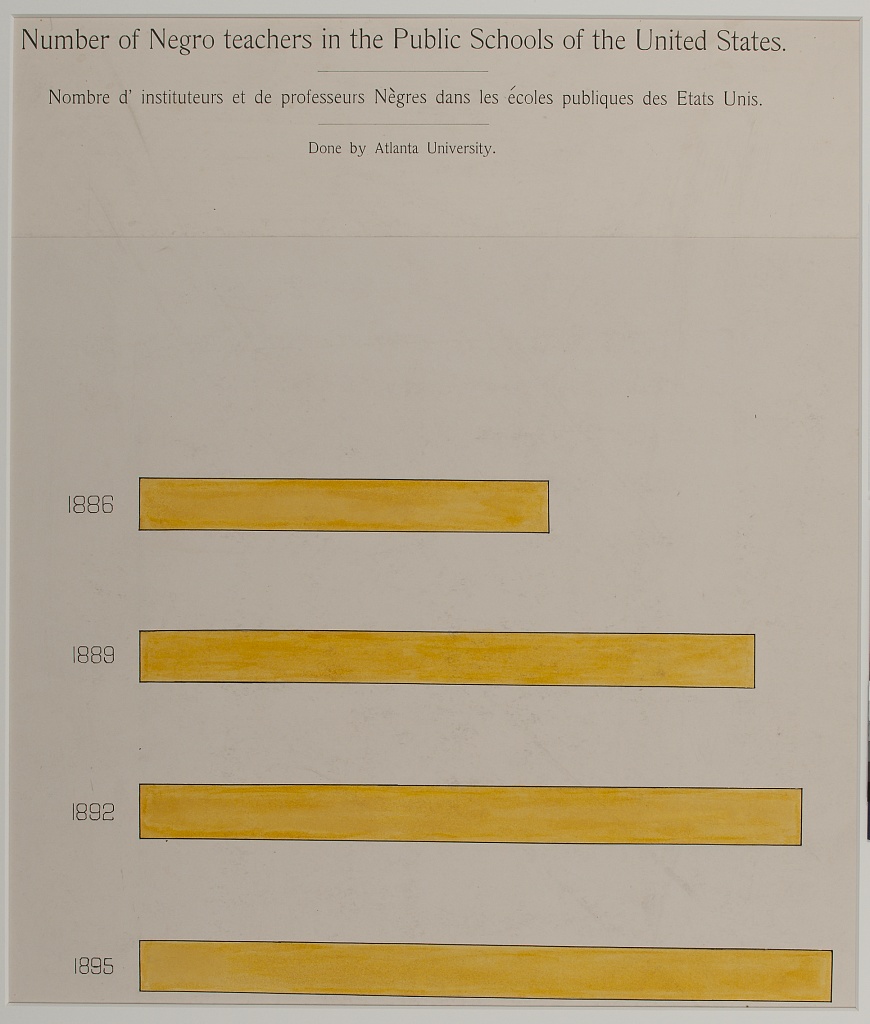
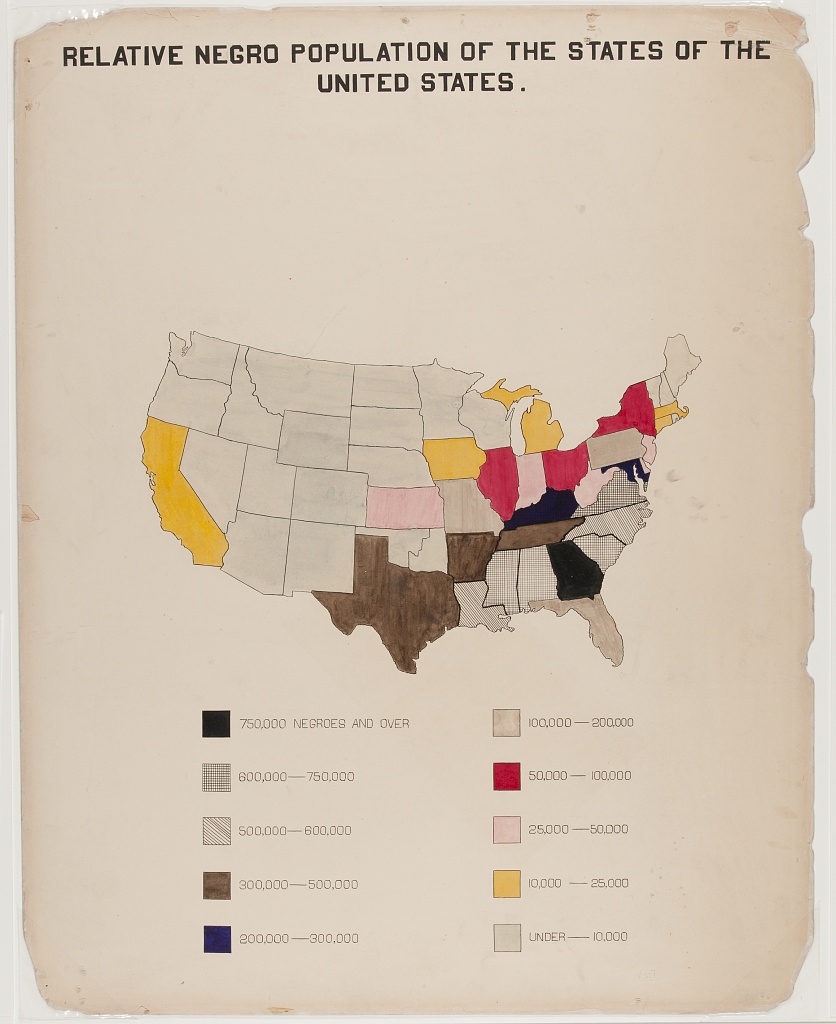
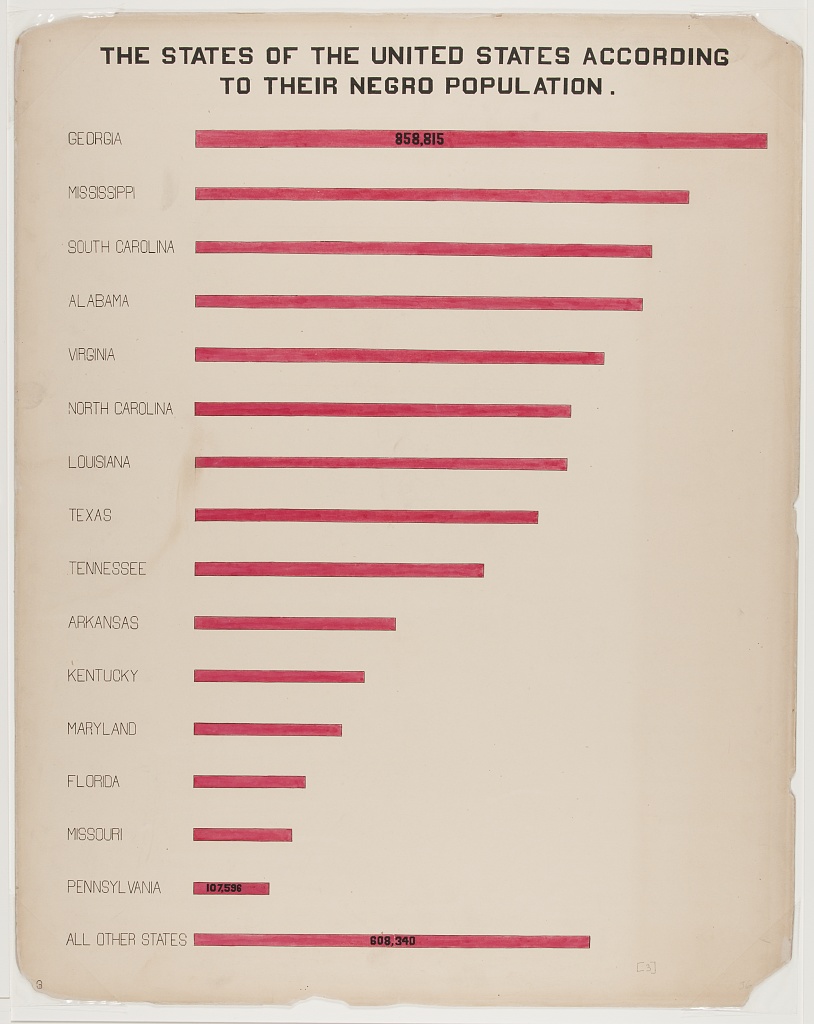
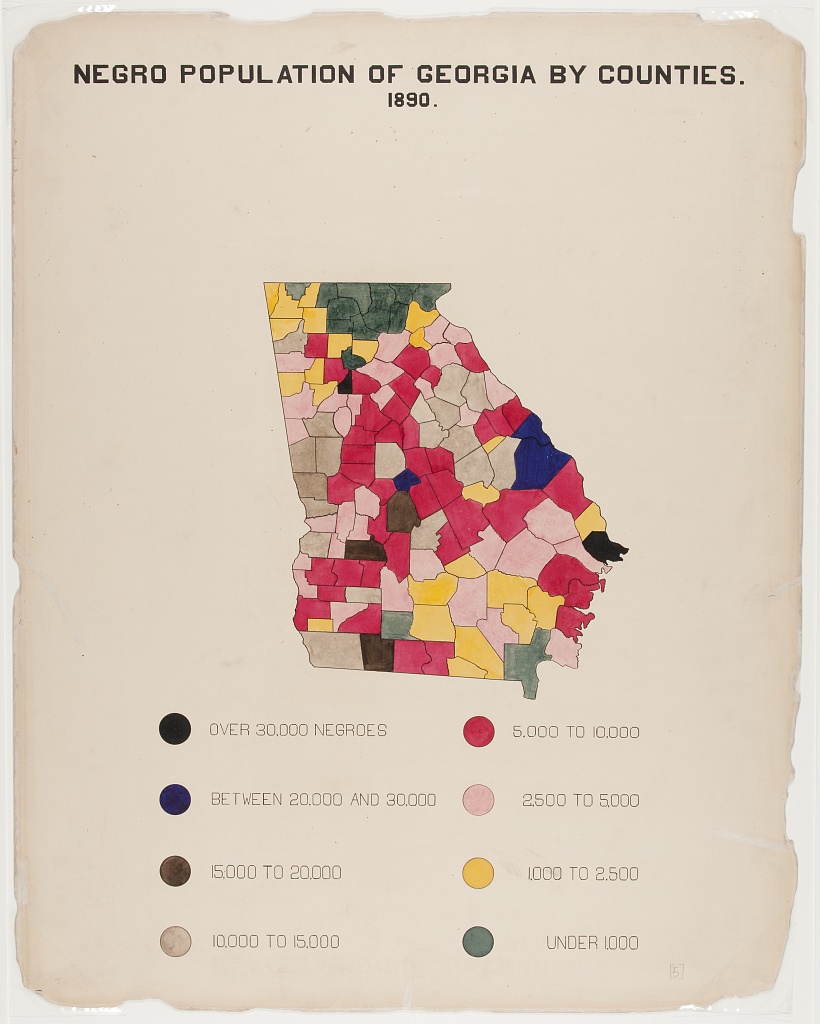
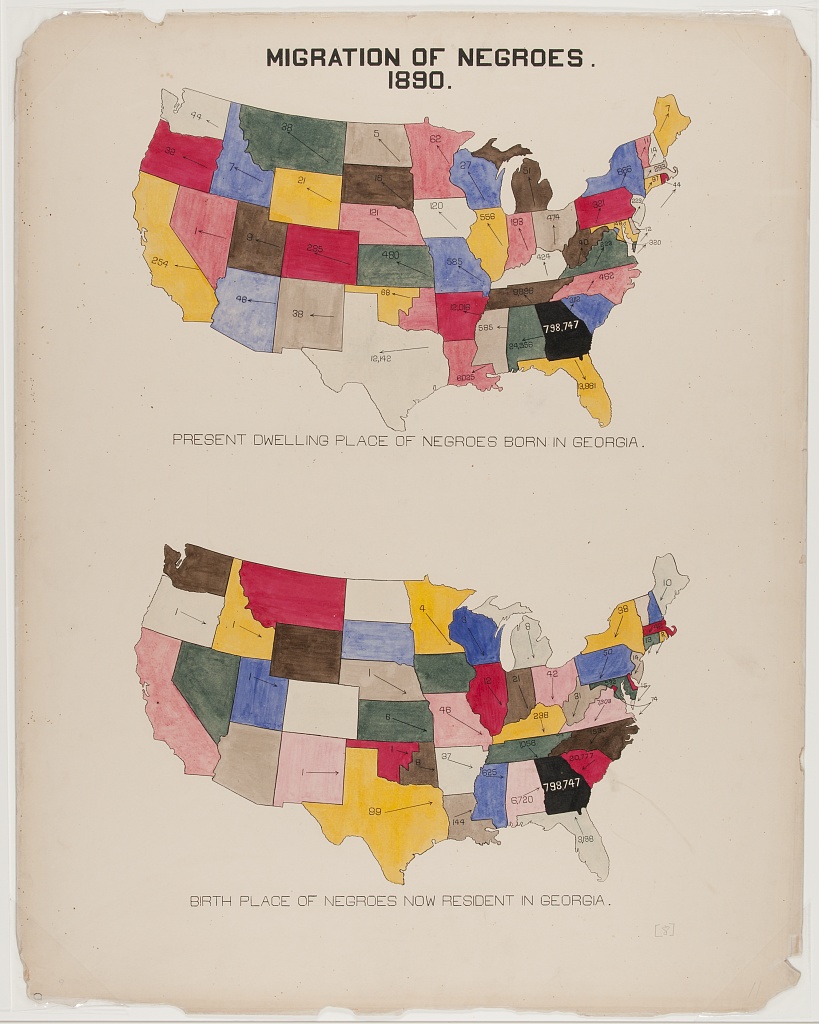
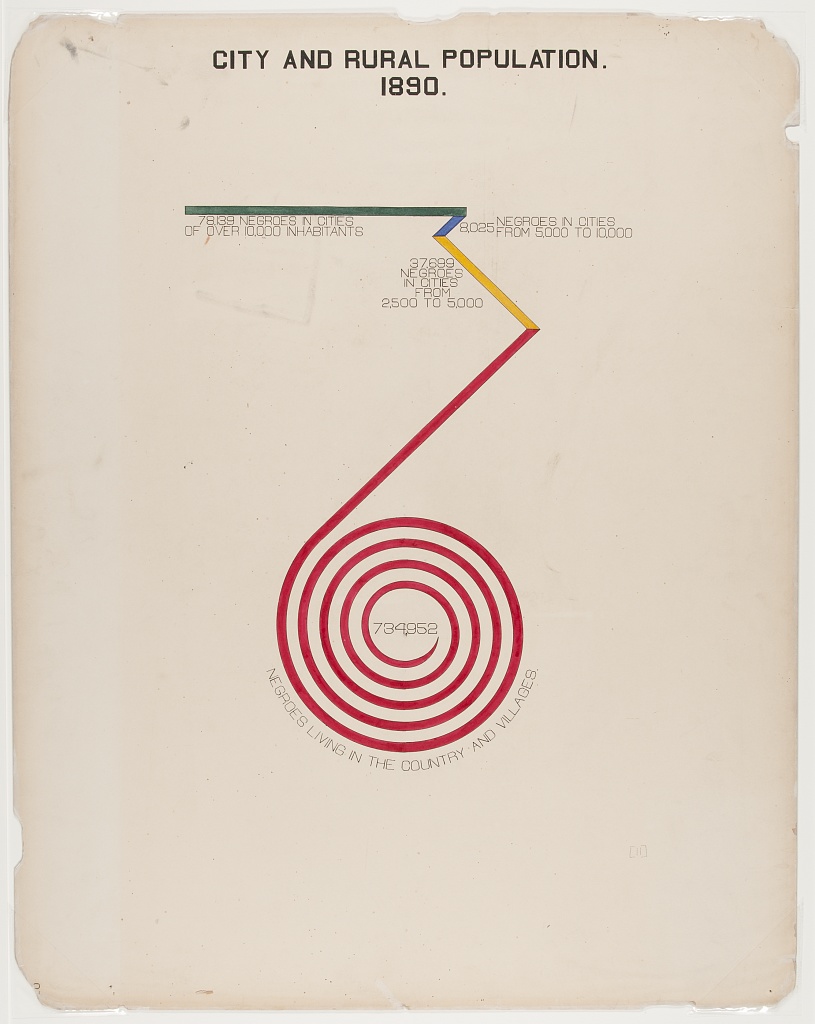
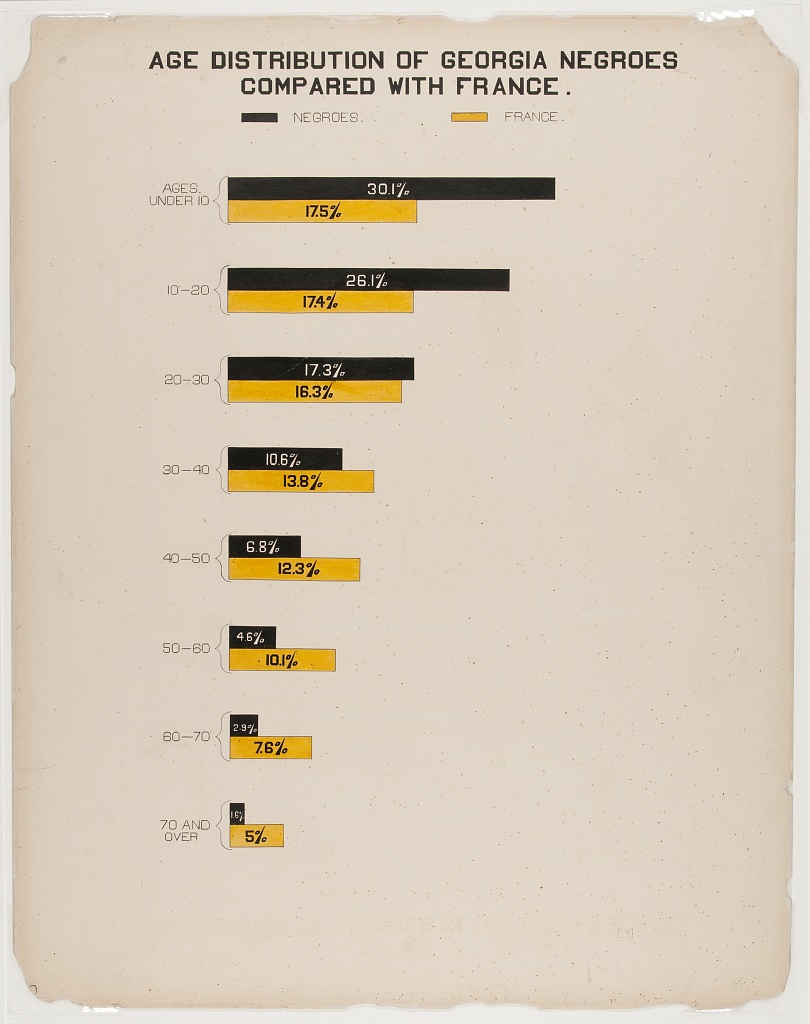
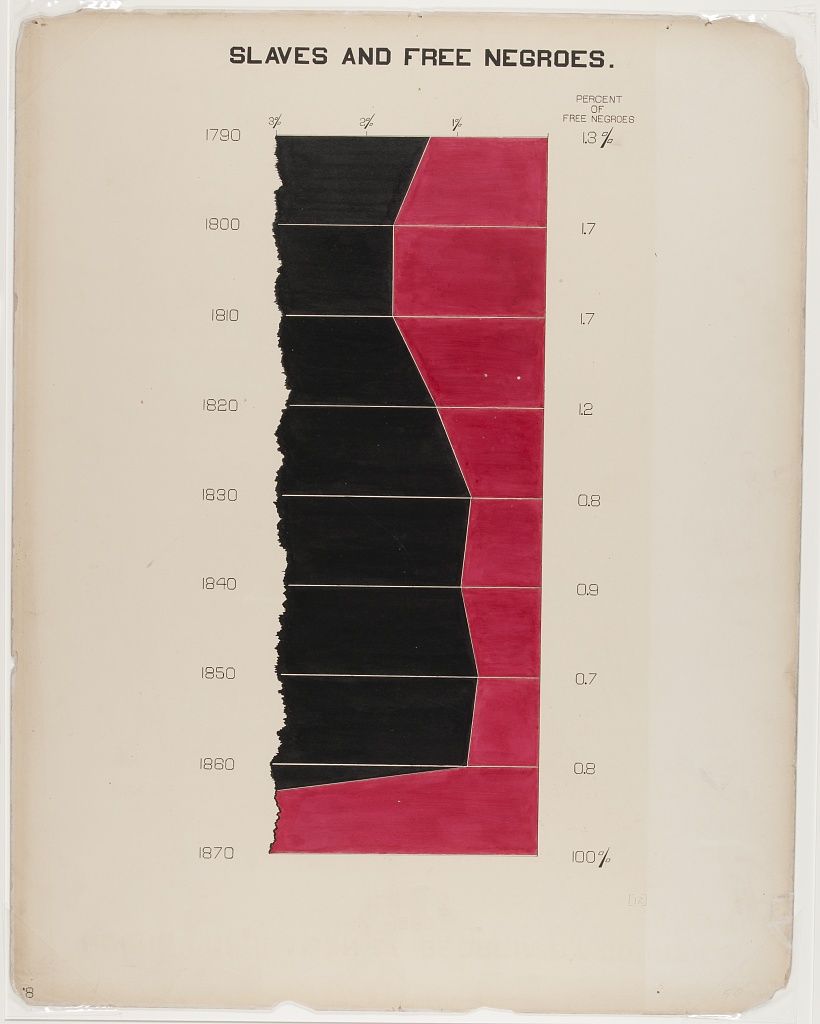
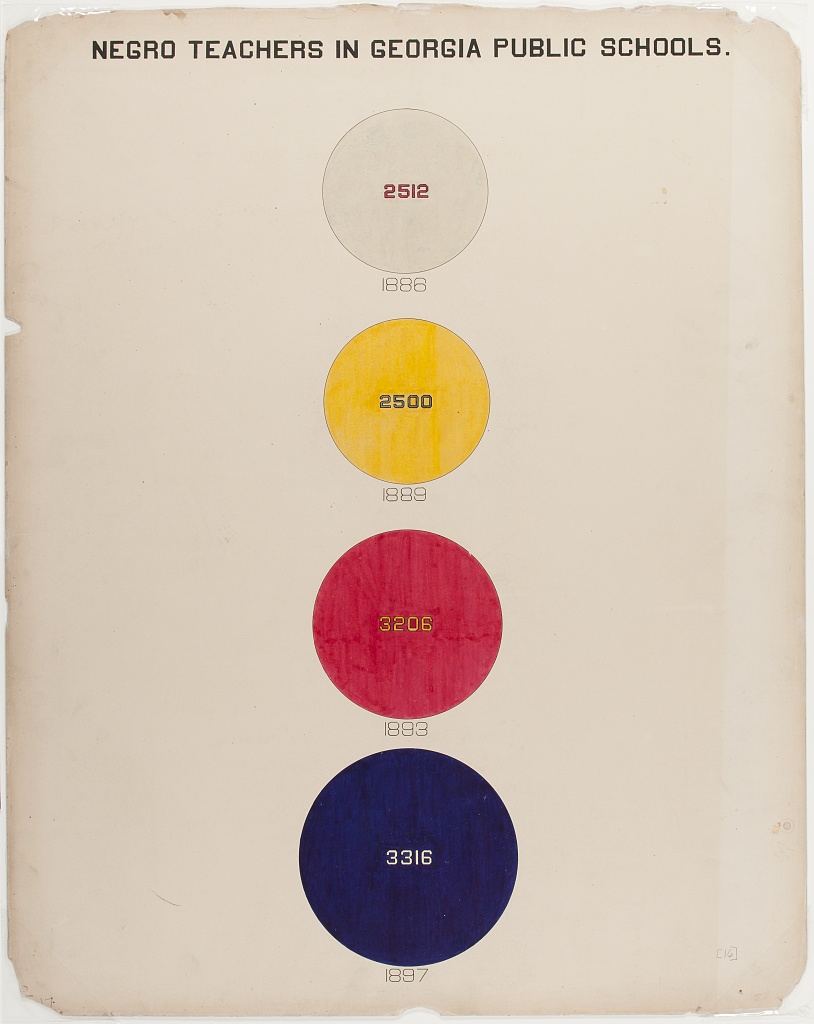
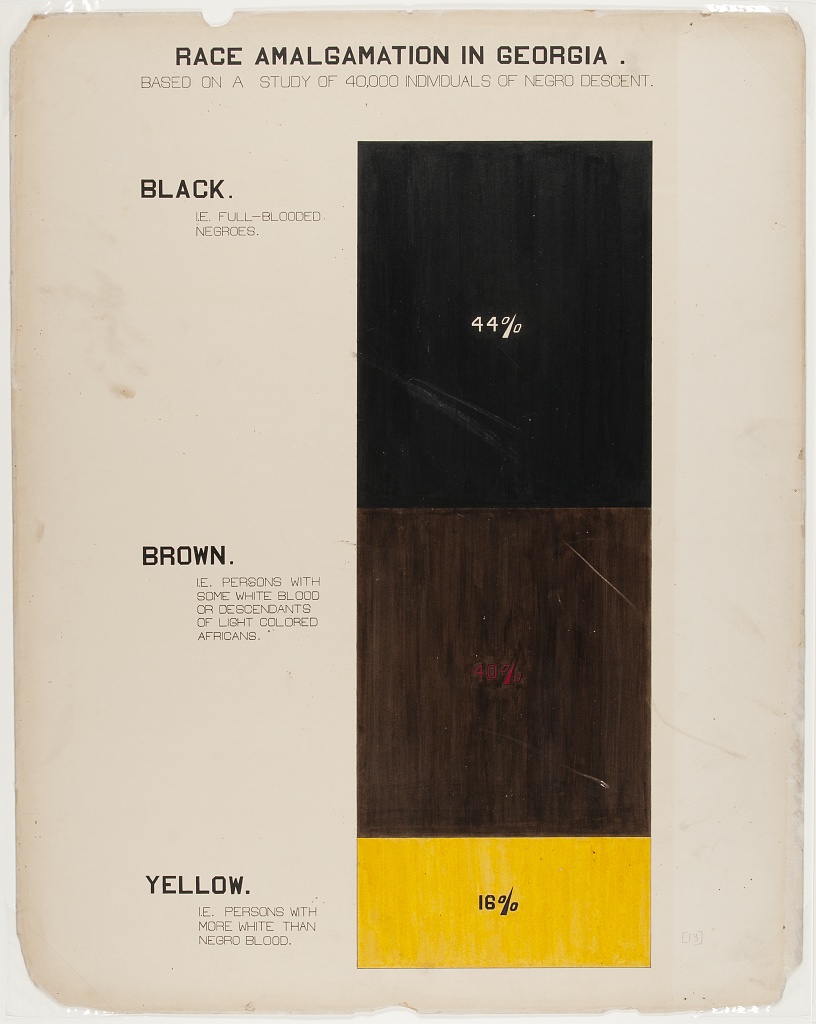
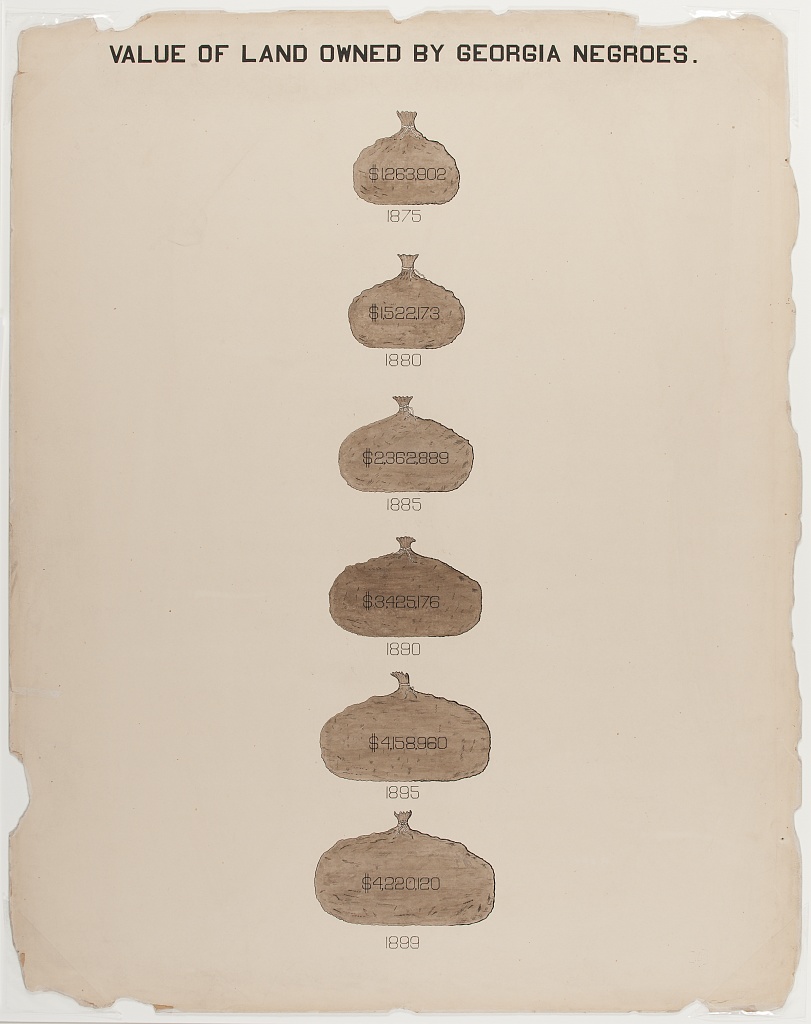
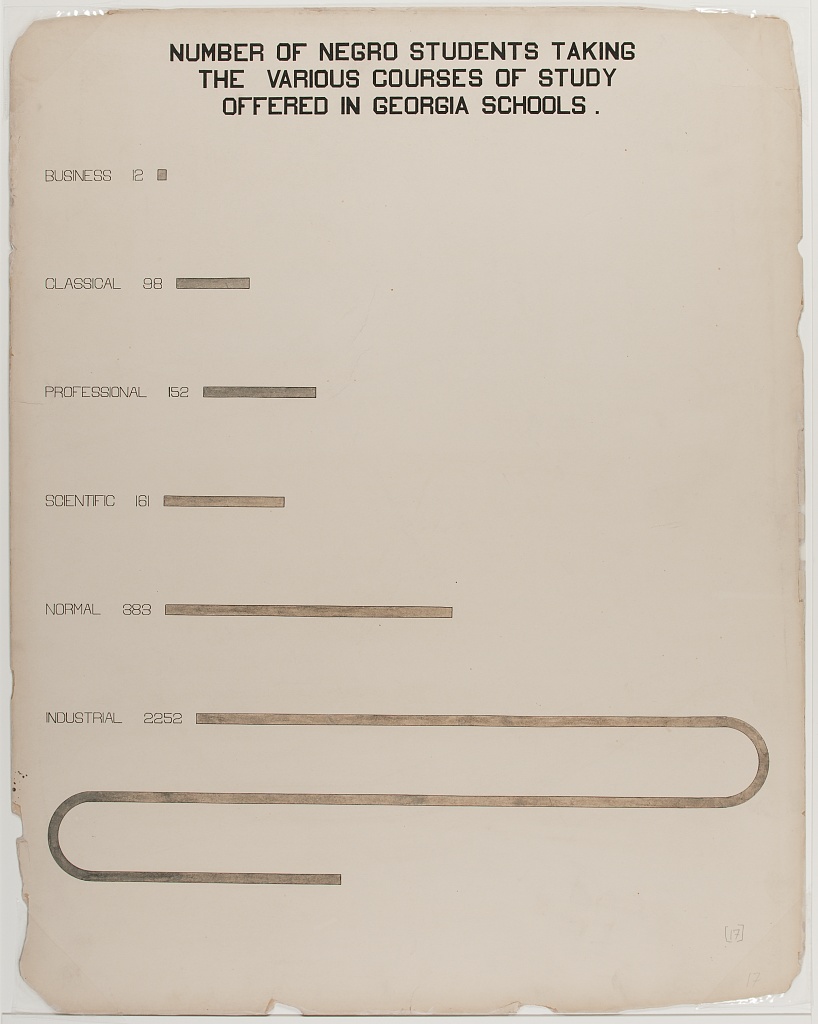
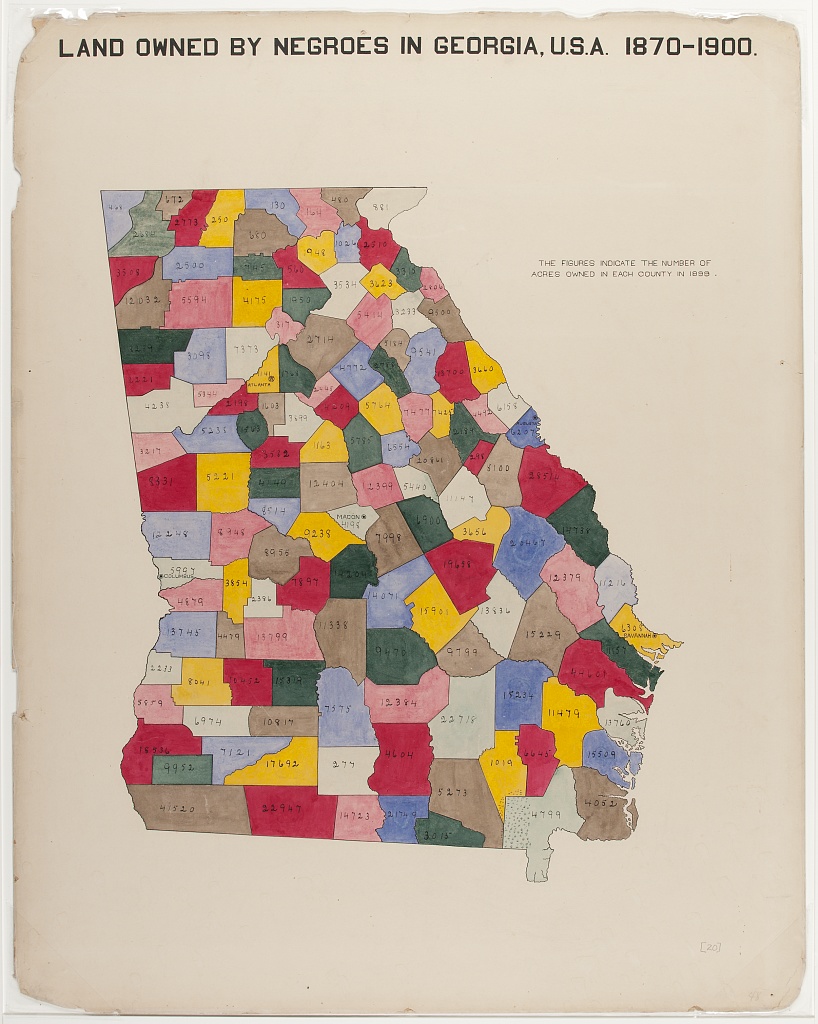
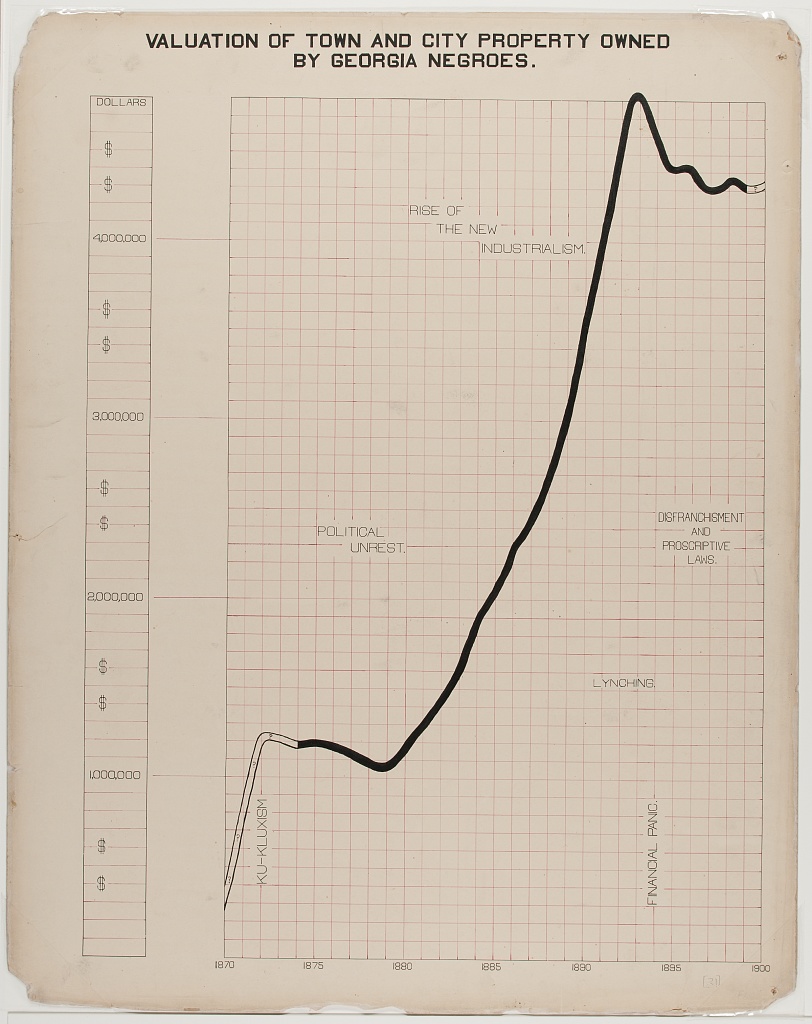
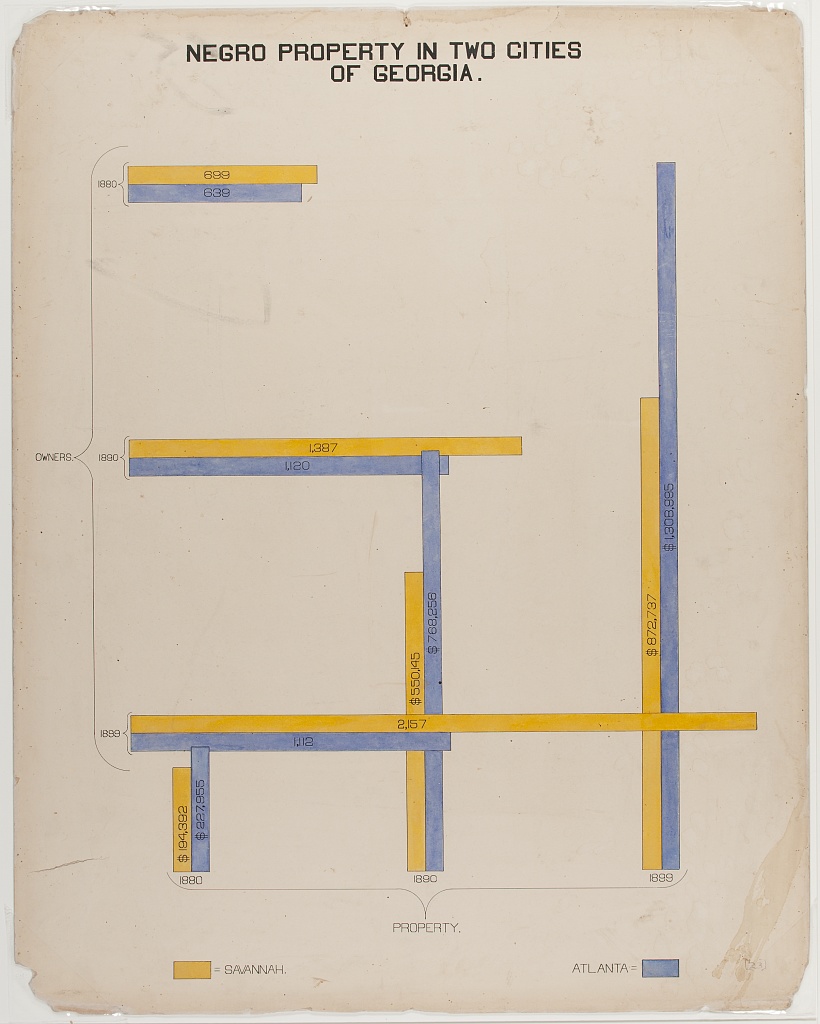
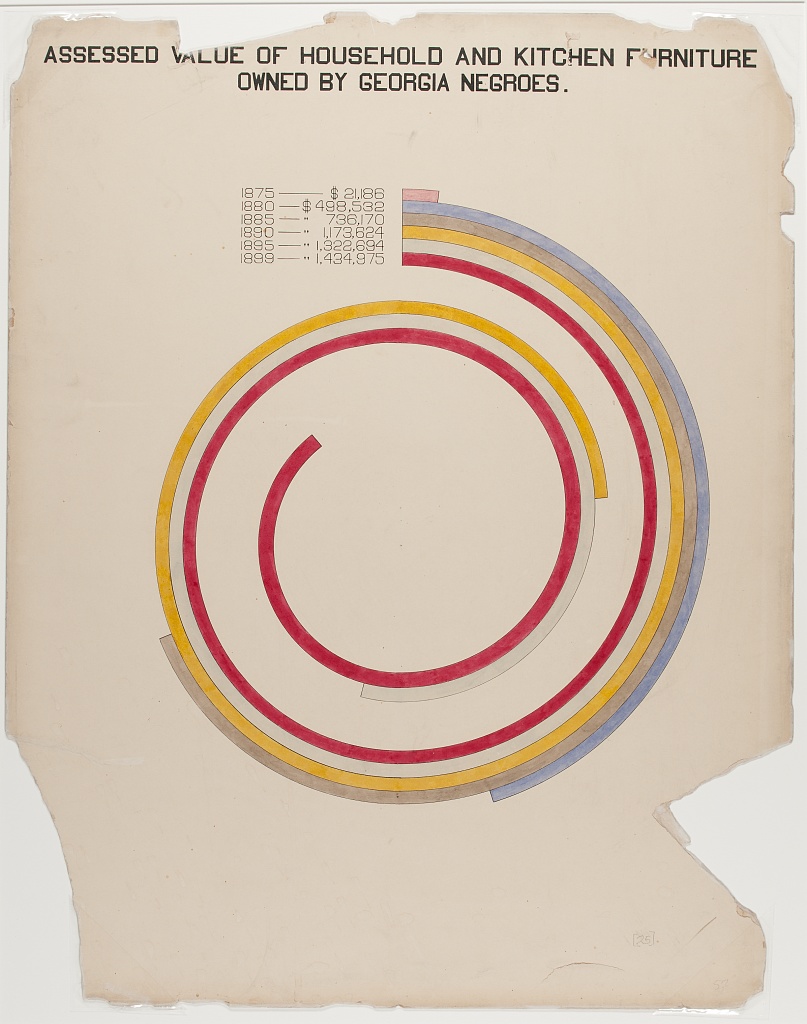
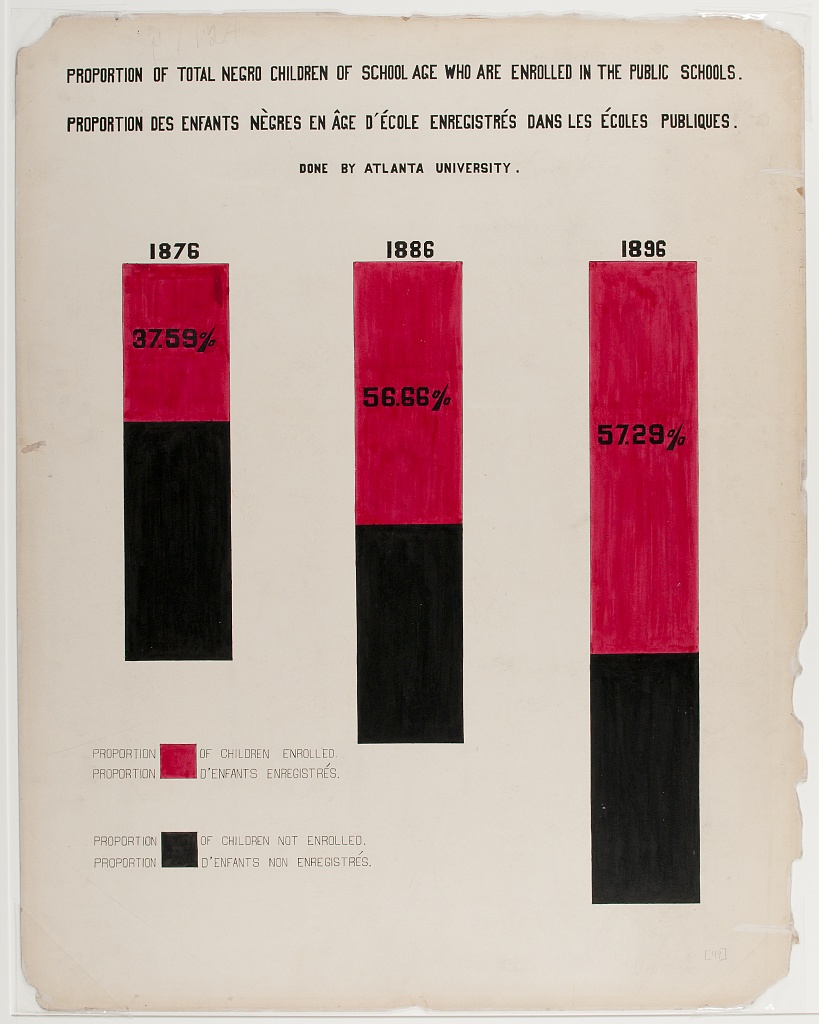
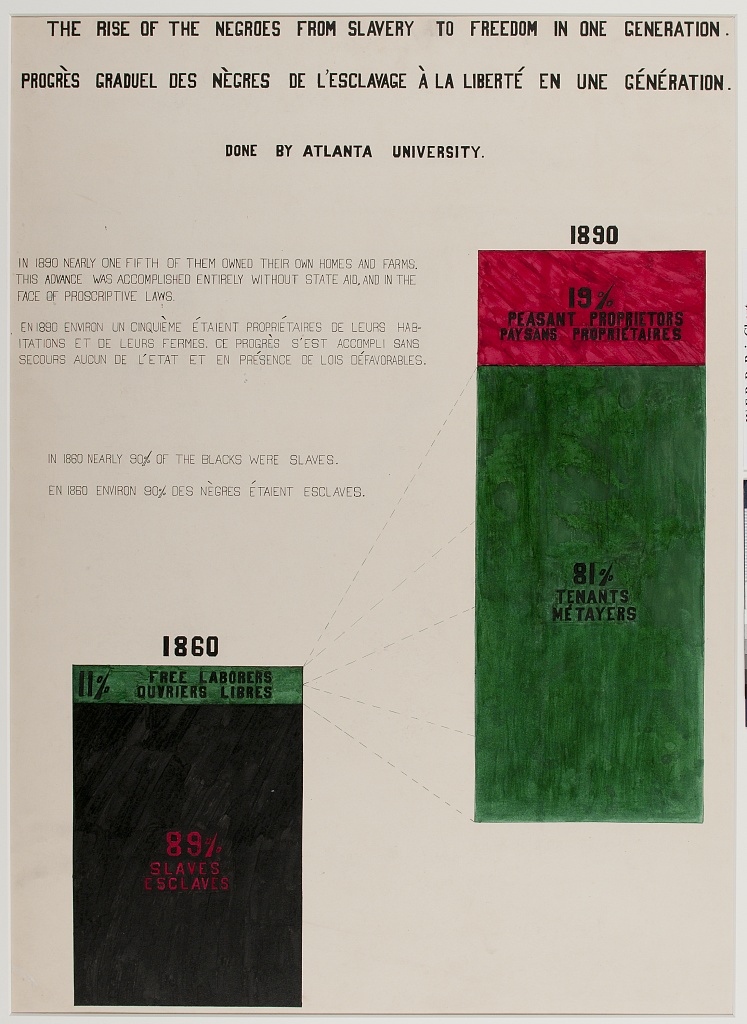
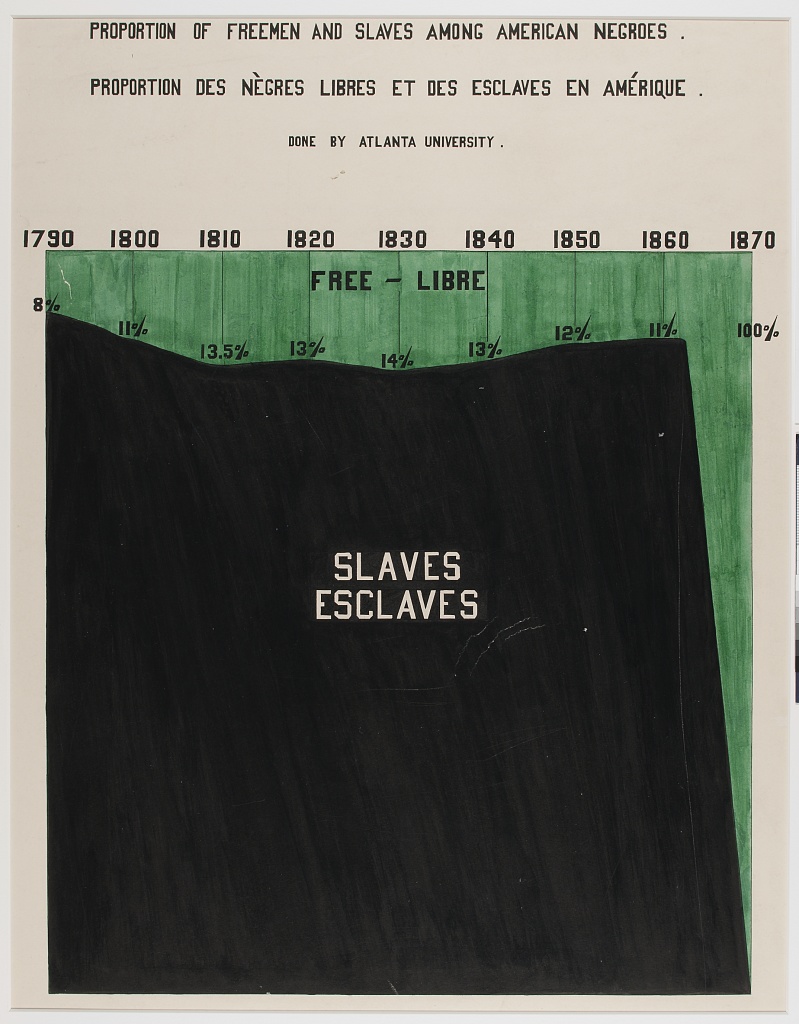
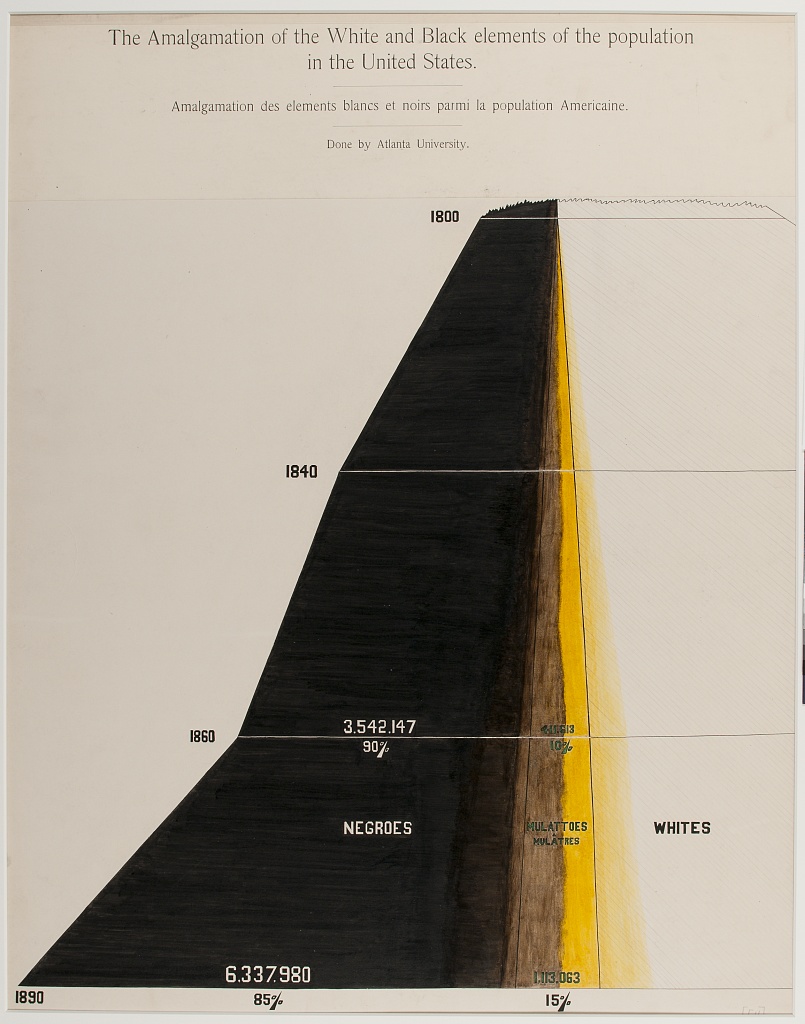
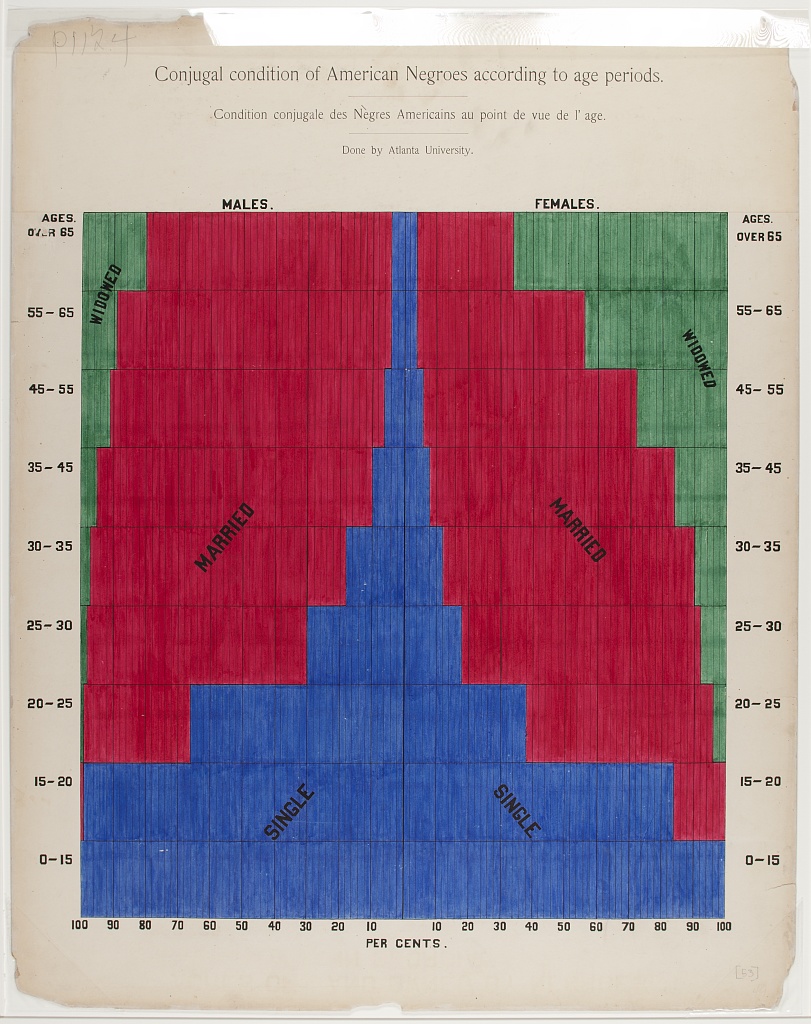
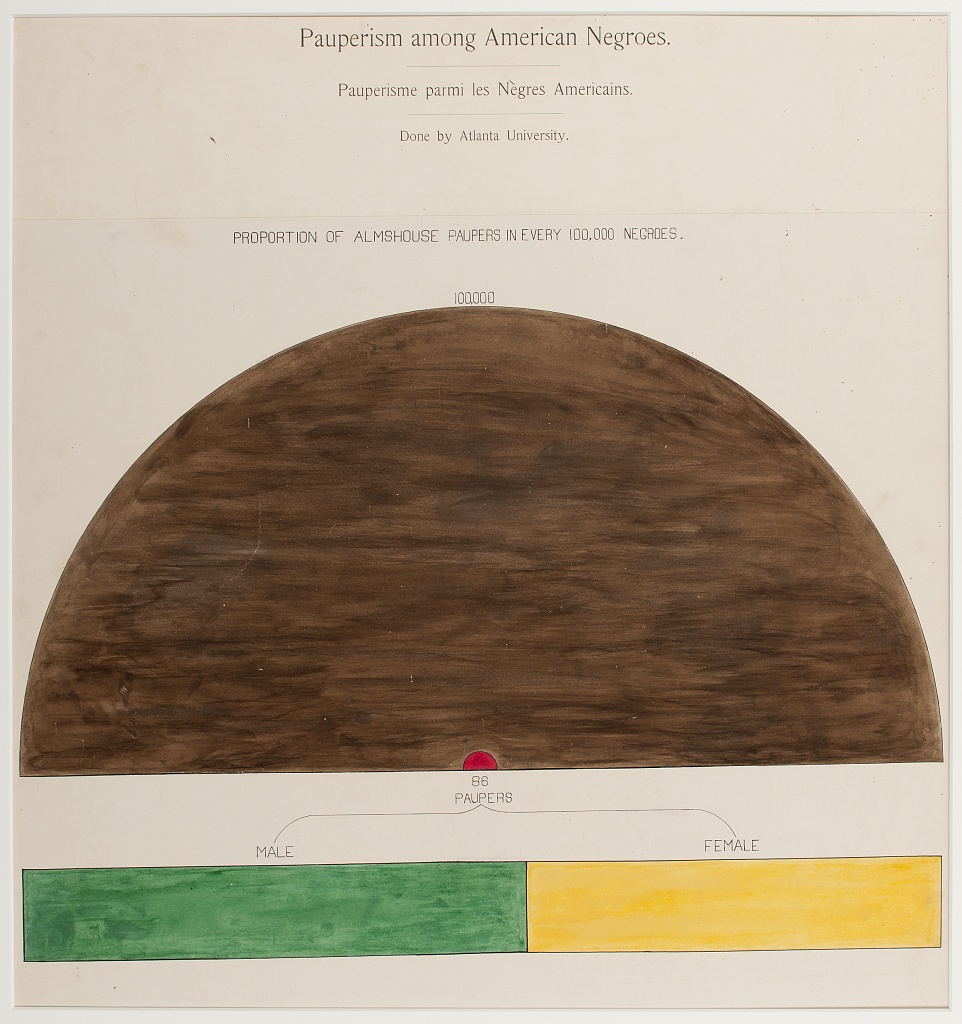
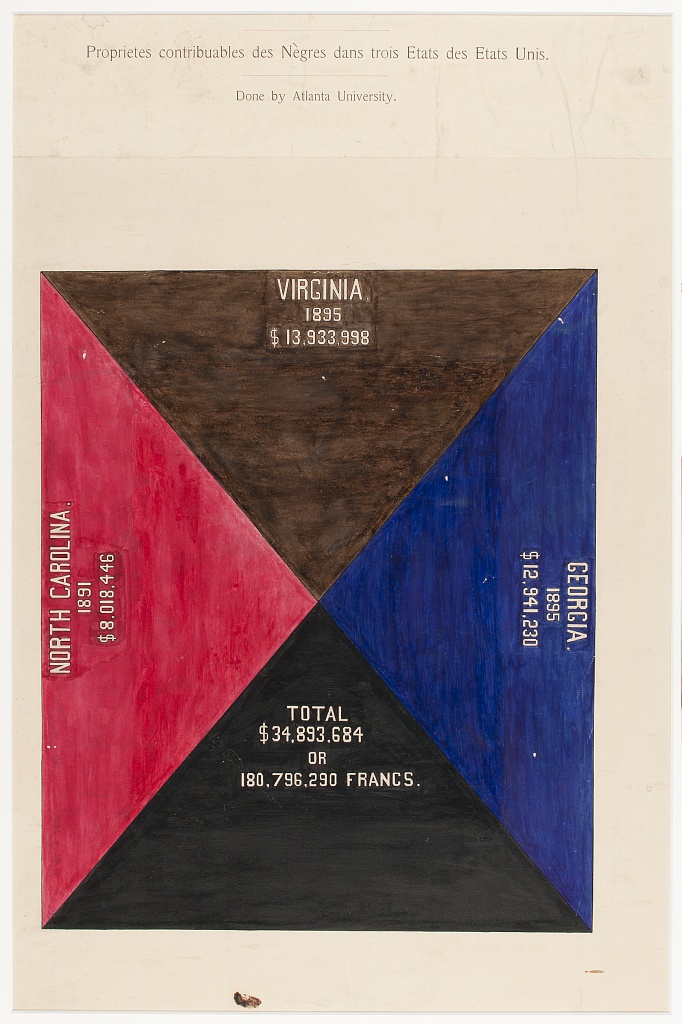
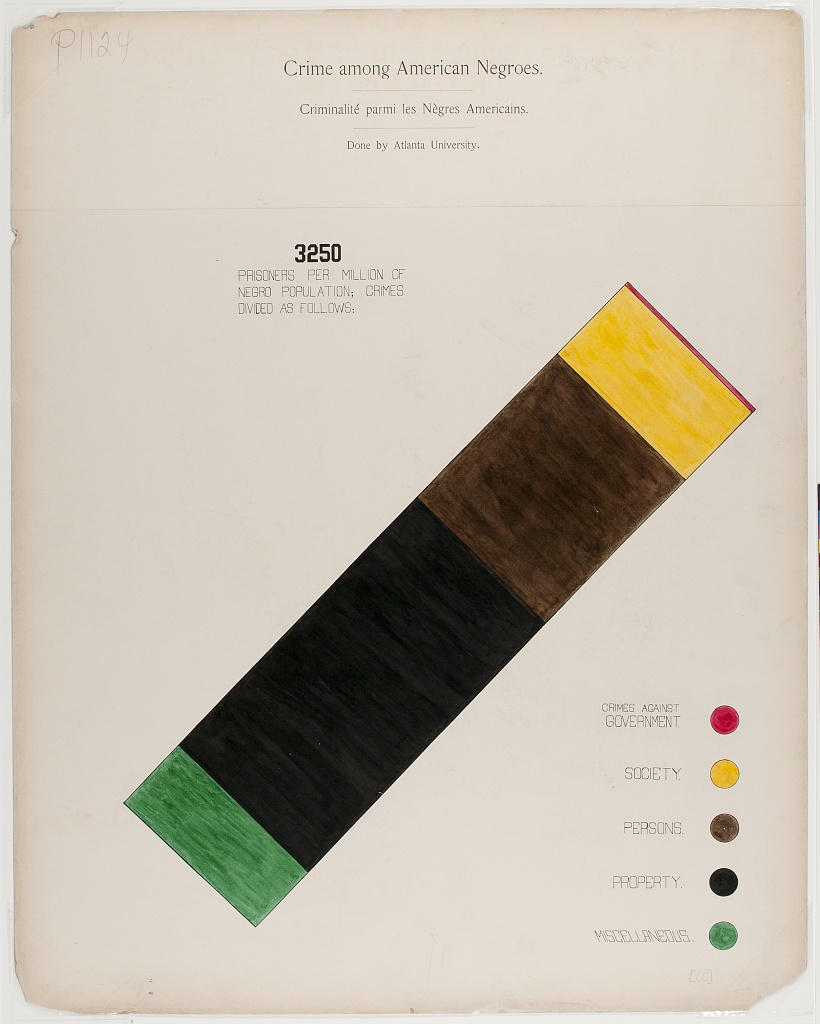
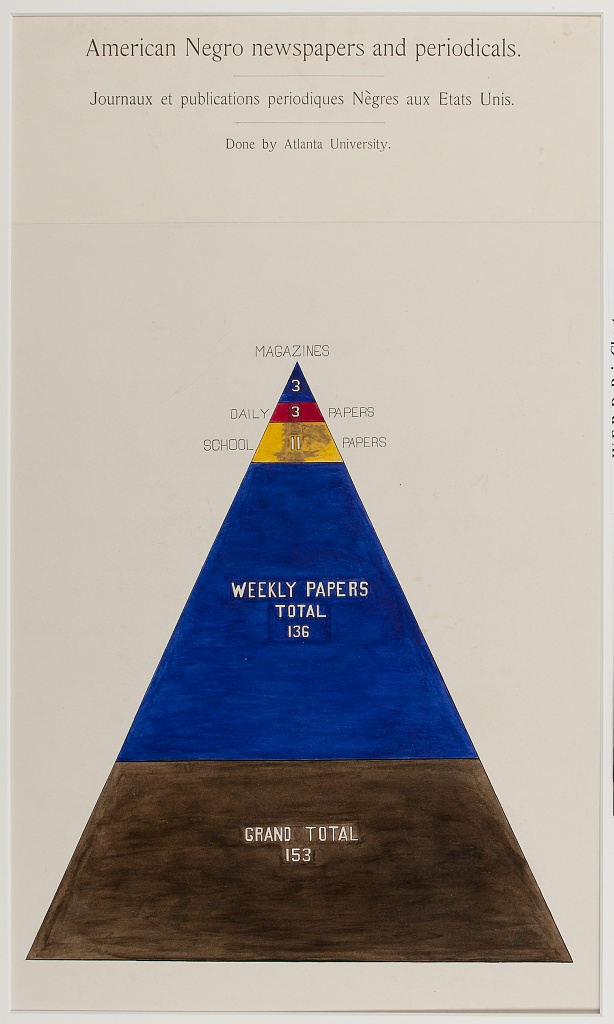
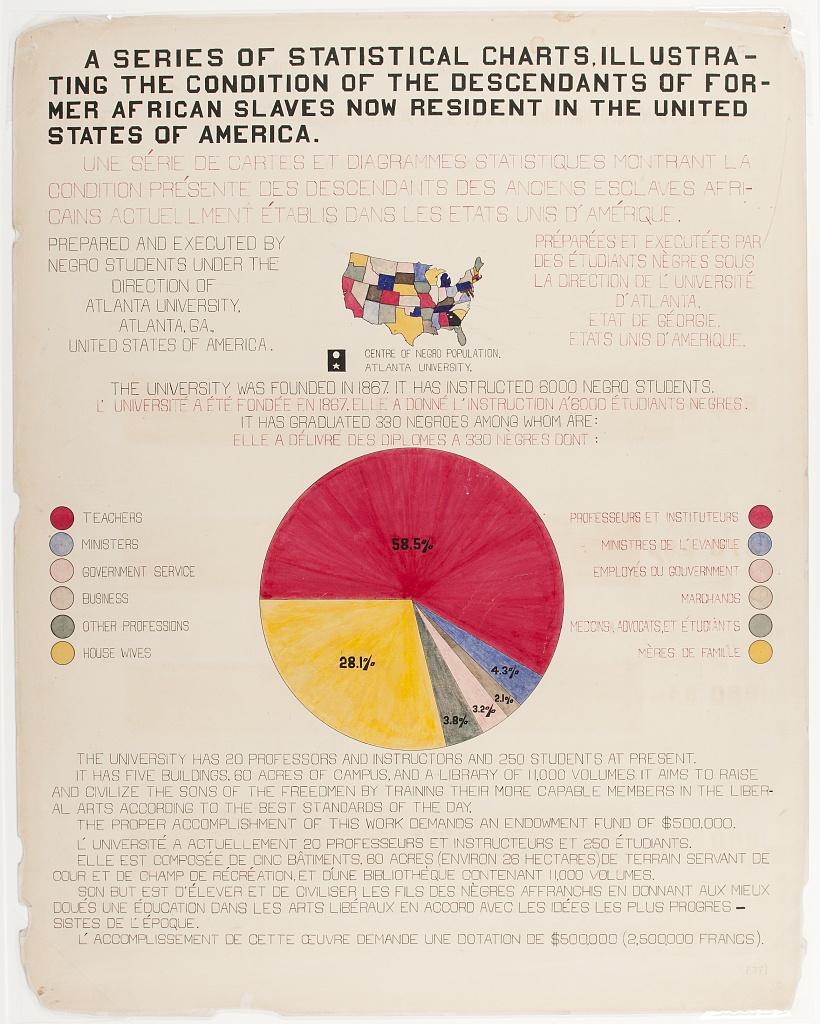
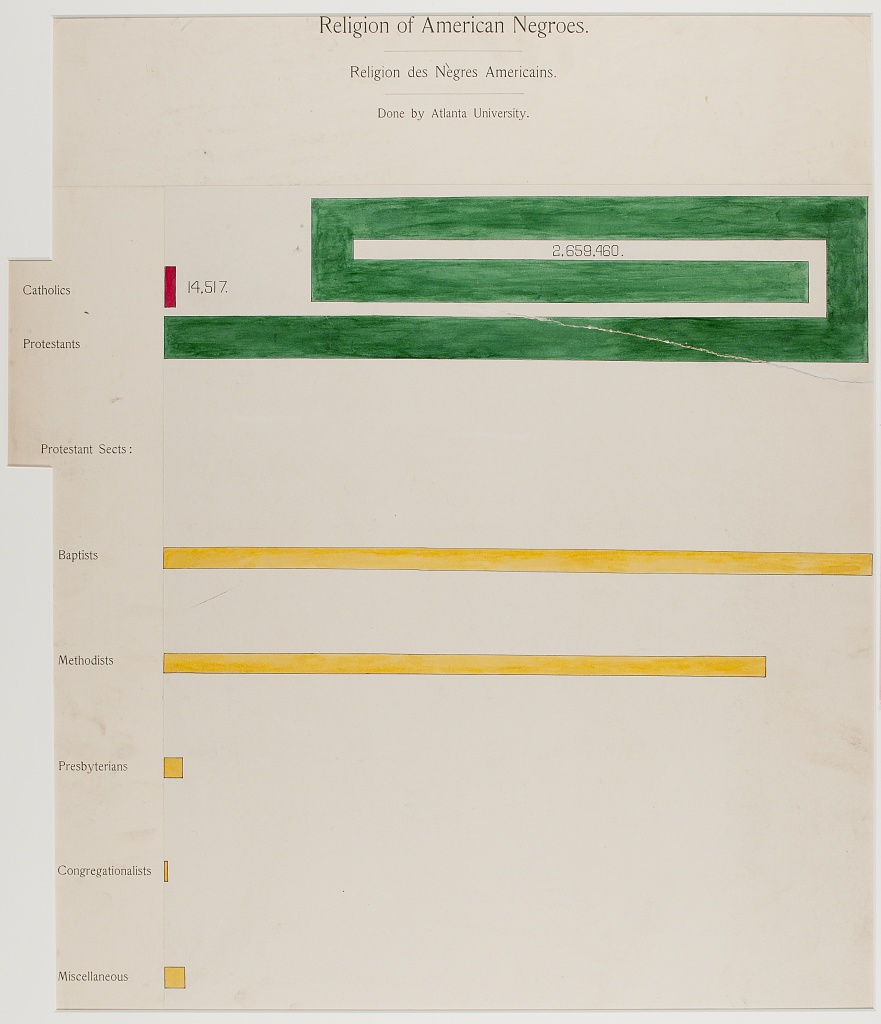
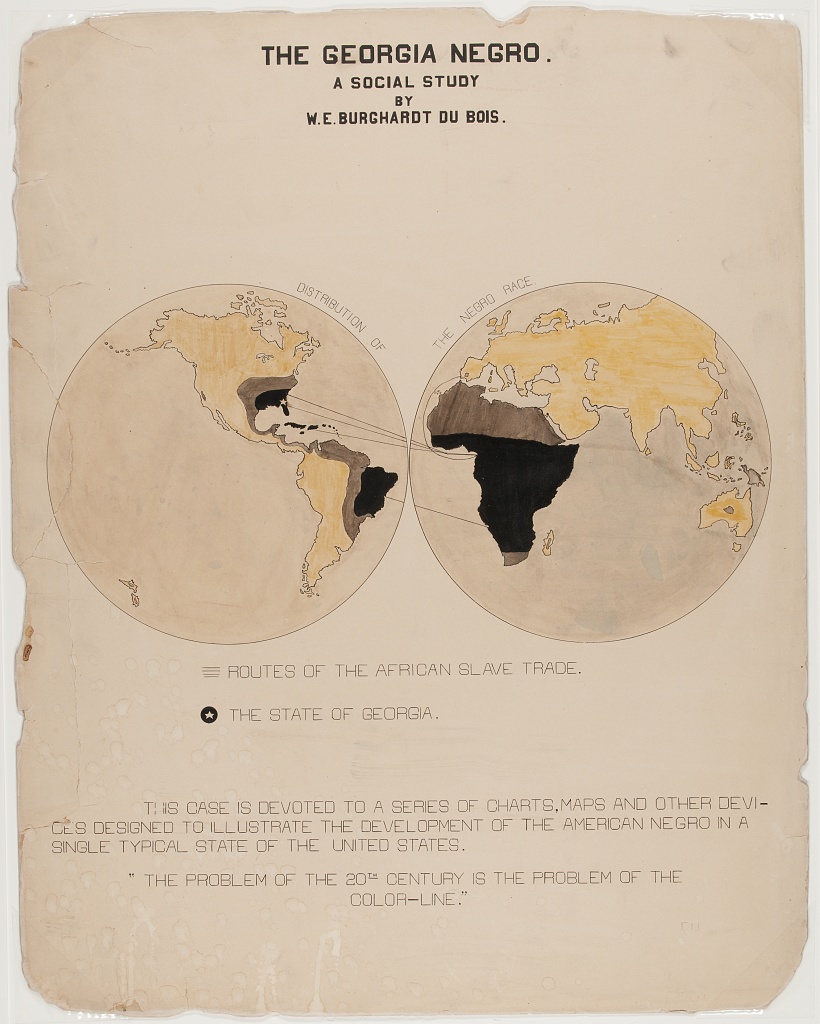
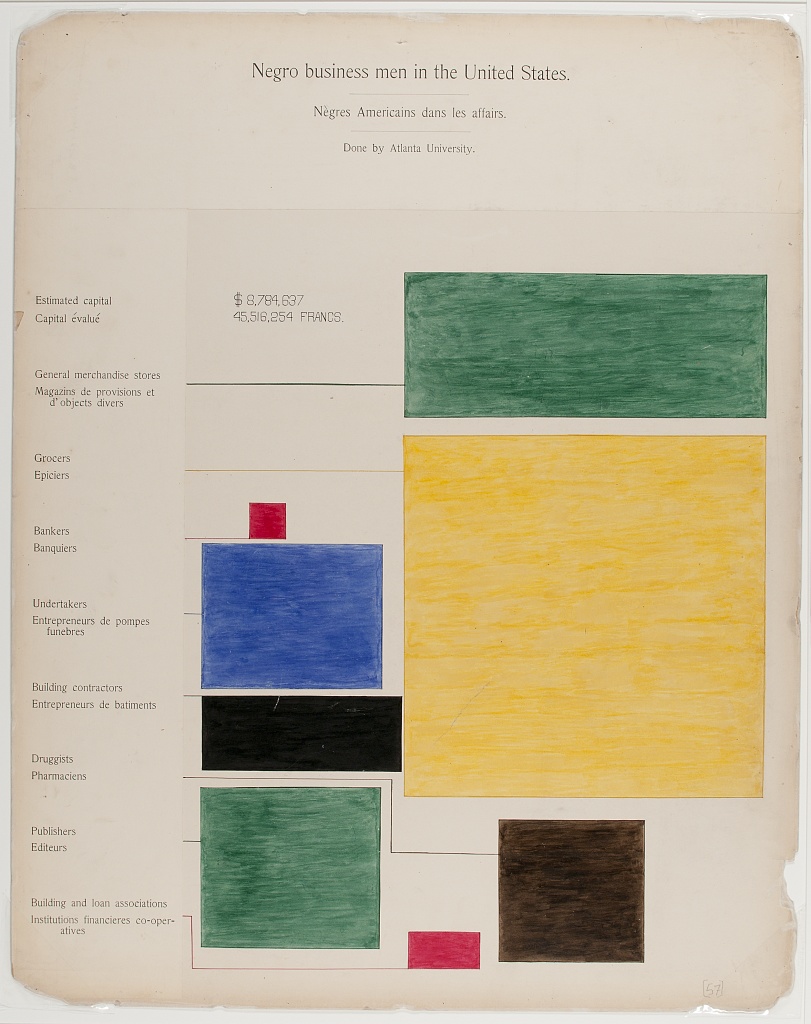
In 1900 civil rights activist, author and intellectual W.E.B. Du Bois (William Edward Burghardt; 1868-1963) presented a series of 58 hand-drawn infographics for The Exhibit of American Negroes exhibition at the Exposition Universelle in Paris. Curated by Du Bois, Booker T. Washington and Thomas J. Calloway, the visualized statistics would become objects of knowledge and reveal the state of black life in the United States.
Du Bois, the first African American person to receive a doctorate from Harvard, understood education’s transformative power. Made by sociology students at Atlanta University (Clark Atlanta University), where Du Bois was professor of history, sociology and economics, the infographics show statistics on African-Americans across the United States, and more specifically in the state of Georgia.
Du Bois foresaw the power of images and what would become data journalism, noting in Dusk of Dawn:
“I could see that the scientific task of the twentieth century would be to explore and measure the scope of chance and unreason in human action, which does not yield to argument but changes slowly and with difficulty after long study and careful development.”
Ellen Terrell, of the Library of Congress, cites a report by Calloway that laid out the exhibit’s aims:
It was decided in advance to try to show ten things concerning the negroes in America since their emancipation: (1) Something of the negro’s history; (2) education of the race; (3) effects of education upon illiteracy; (4) effects of education upon occupation; (5) effects of education upon property; (6) the negro’s mental development as shown by the books, high class pamphlets, newspapers, and other periodicals written or edited by members of the race; (7) his mechanical genius as shown by patents granted to American negroes; (8) business and industrial development in general; (9) what the negro is doing for himself though his own separate church organizations, particularly in the work of education; (10) a general sociological study of the racial conditions in the United States.
The many shapes used in the the graphs and diagrams draw you in. The mix and clarity makes deciphering the message easy and interesting, turning bald and bland statistics into objects that show without telling or preaching, expanding a viewer’s monocular vision narrowed by prejudice through simplicity and color.
Would you like to support Flashbak?
Please consider making a donation to our site. We don't want to rely on ads to bring you the best of visual culture. You can also support us by signing up to our Mailing List. And you can also follow us on Facebook, Instagram and Twitter. For great art and culture delivered to your door, visit our shop.
